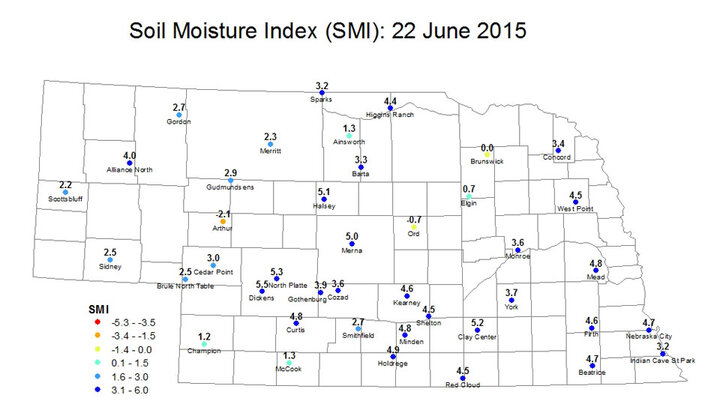
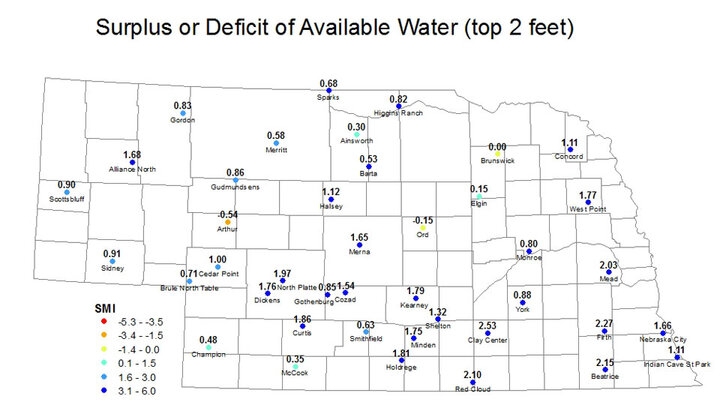
Conditions remain quite moist statewide, with all crop reporting districts having an average soil moisture index (SMI) of well above 0.0 — the break-even point for soil moisture. Three districts (East Central, South Central, and Southeast) have an average SMI above 4.0.
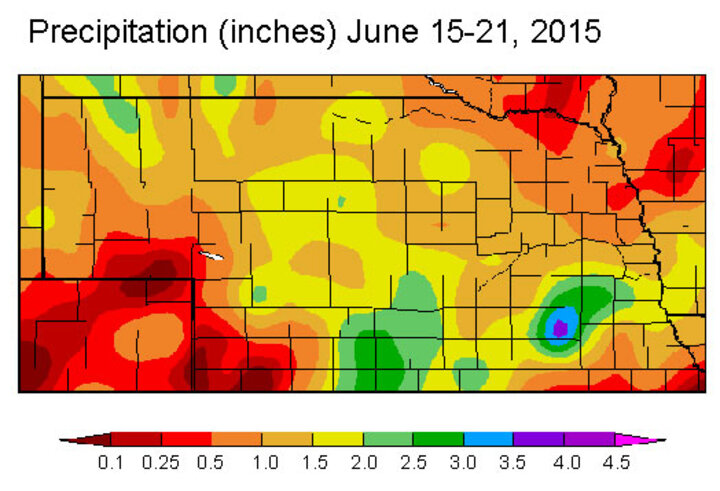
Still, most locations in northeast and southwest Nebraska saw less than an inch of precipitation over the past week and some locations in those regions have dried a little over the past week. Last week all stations on the map were over 0.0, which even as wet as the spring has been for most of Nebraska, was a first for the 2015 season. This week, however, Ord is back to negative (-0.7) and Arthur is down to -2.1.
The story earlier in the season was the remarkable soil wetness in the Panhandle and eastern Nebraska and the nagging, abormnally dry conditions that persisted through central Nebraska, especially between Highway 281 and Highway 14. The northern stretch of that section remains the driest part of the state, but copious rains in recent weeks have turned the prime irrigated region of south central Nebraska into one of the wettest regions in the state.
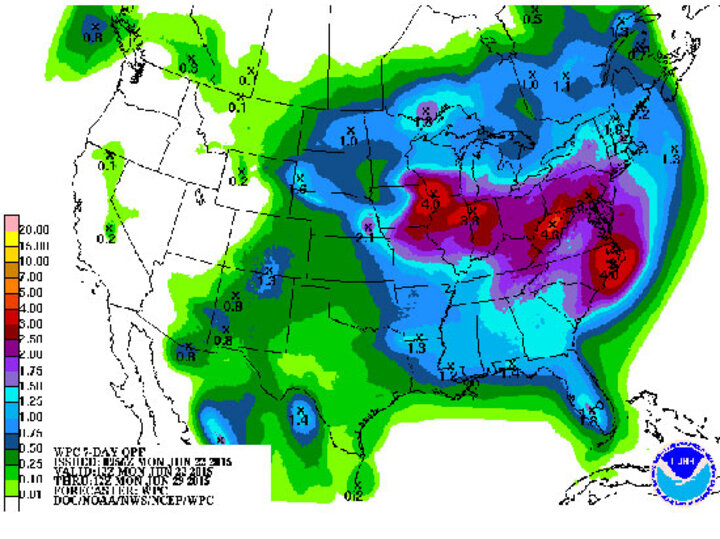
Precipitation over 1 inch is projected for most of the northern third and eastern half of the state with 0.25 to 0.50 inch predicted elsewhere. That combined with seasonal to below average temperatures for most of next week should keep most of the state moist through the next week.
Average SMI by USDA NASS Crop District
(Districts and EPA Ecoregions Defined)
Northwest (District 10): 2.8North Central (District 20): 2.6
Northeast (District 30): 2.1
Central (District 50): 3.5
East Central (District 60): 4.0
Southwest (District 70): 3.4
South Central (District 80): 4.2
Southeast (District 90): 4.5
Note: The Soil Moisture Index (SMI) is based on the estimated field capacity and wilting point at three depths (10 cm, 25 cm, 50 cm) at Automated Weather Data Network (AWDN) sites under grass cover. The index may not necessarily be representative of conditions of a nearby field, particularly if differences in total precipitation over the previous week have been significant.
Eric Hunt
High Plains Regional Climate Center