Soil Moisture Update
July 13, 2015| Table 1. Average Soil Moisture Index by USDA NASS Crop District. (Districts and EPA Ecoregions Defined) The number in parentheses shows the change from the previous week. | ||
| Northwest | 0.7 | (+0.1) |
| North Central | 1.1 | (+0.7) |
| Northeast | -0.4 | (+1.0) |
| Central | -1.0 | (-1.5) |
| East Central | 2.5 | (-0.6) |
| Southwest | -0.1 | (-0.9) |
| South Central | -0.1 | (-0.8) |
| Southeast | 1.2 | (-0.8) |
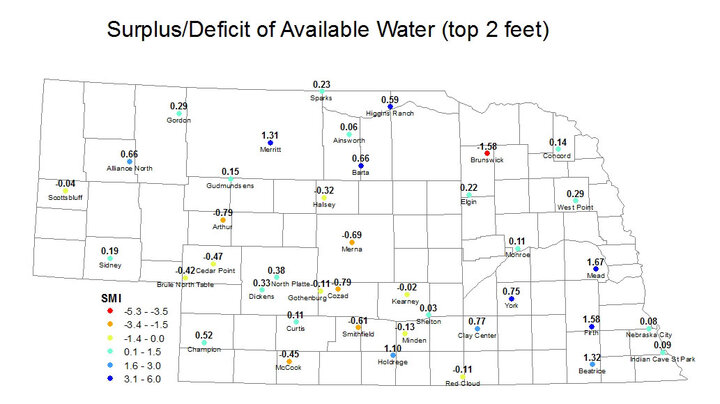
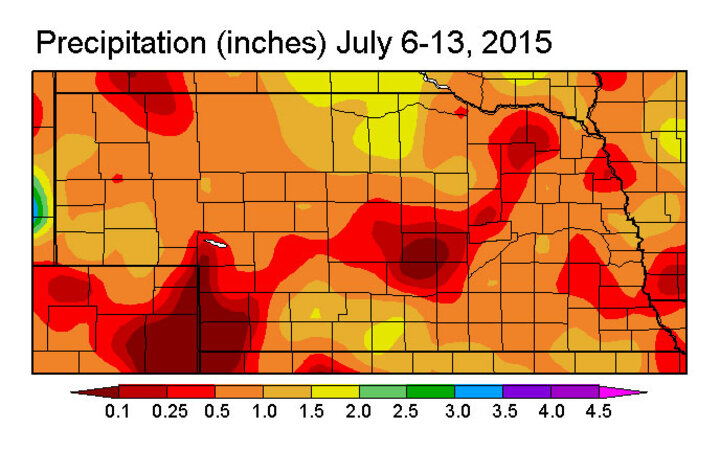
Precipitation over the past week mostly defied the projections as the areas with the most precipitation and largest soil moisture improvements were generally over the northern third of the state. The biggest winner was at Elgin, which received over 2 inches of rain and went from a soil moisture index (SMI) of -03.9 and a deficit of -0.86 to an SMI of 1.0 and a surplus of 0.22. Other sites in the northwest, north central, and northeast also had slight to modest improvements with the combination of precipitation and cooler temperatures through much of the week.
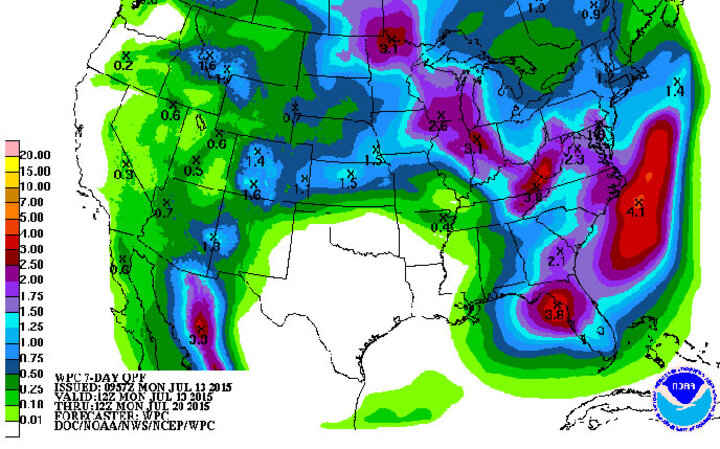
Soils continued to slowly dry over most of the remainder of the state and 14 stations reported an SMI below 0.0. With temperatures expected to remain relatively hot for most of the week statewide, most locations would need at least an inch of rain to hold their numbers steady. The national Weather Predcition Center gives a good shot at rain (mostly midweek), but the more copious amounts will be more localized than widespread, as is often the case with mid-summer precipitation in the Central Plains and western Corn Belt.
Note: The Soil Moisture Index (SMI) is based on the estimated field capacity and wilting point at three depths (10 cm, 25 cm, 50 cm) at Automated Weather Data Network (AWDN) sites under grass cover. The index may not necessarily be representative of conditions of a nearby field, particularly if differences in total precipitation over the previous week have been significant.
Eric Hunt
High Plains Regional Climate Center
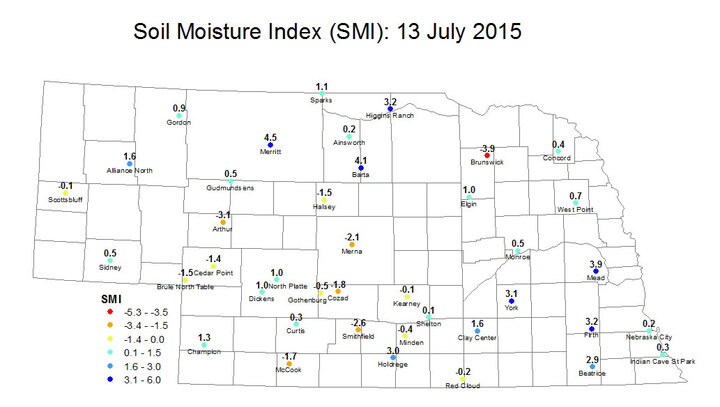
Figure 3. Soil moisture index in the top 0-50 cm of soil.