
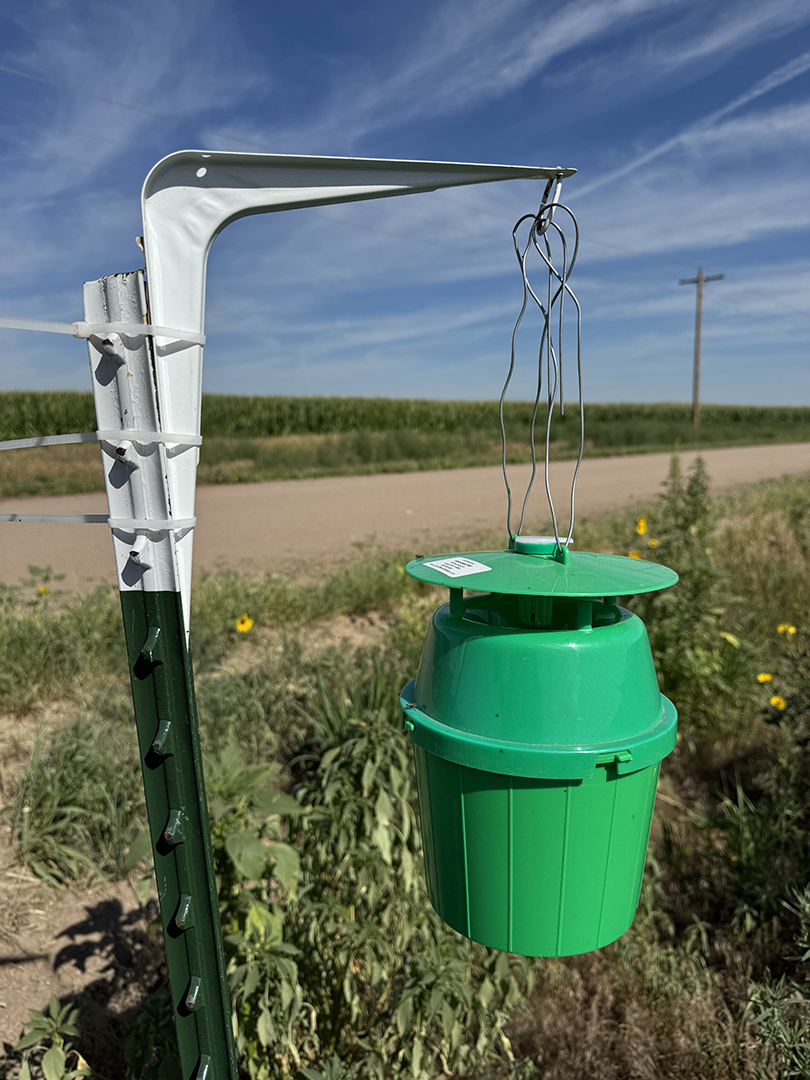
During the 2025 growing season, research and extension personnel across Nebraska collaborated with the Great Lakes and Maritimes Pest Monitoring Network (GLMPMN) to monitor populations of two important insect pests across the state: western bean cutworm (WBC) and European corn borer (ECB). Trapping was conducted using pheromone lures (the chemical that female moths emit to attract mates) inside of green bucket traps (Figure 1). This network of traps provided real-time data about where these important pest flights were happening across our state (and continent), with data available freely at the GLMPMN website.
Accessing this pest monitoring information can help producers and agricultural advisors decide when and where to target their crop scouting efforts. While information about pest flights cannot tell you if you need to spray (in-field scouting for pest eggs and larvae and use of economic thresholds are still necessary), knowledge about the moth flight can help in deciding when and how to treat a field.
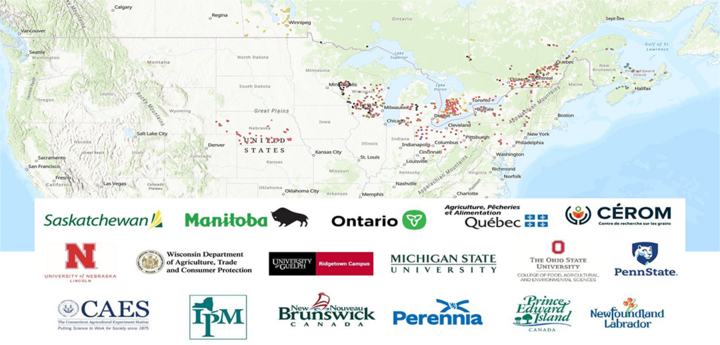
A total of 57 trapping locations for WBC and two for ECB were established in 2025, with weekly sampling collections to determine peak flight times. A total of 12 US states and Canadian provinces participated in 29 weeks of trapping, with over 1,160 trap sites across the U.S. and Canada (Figure 2).
Western Bean Cutworm
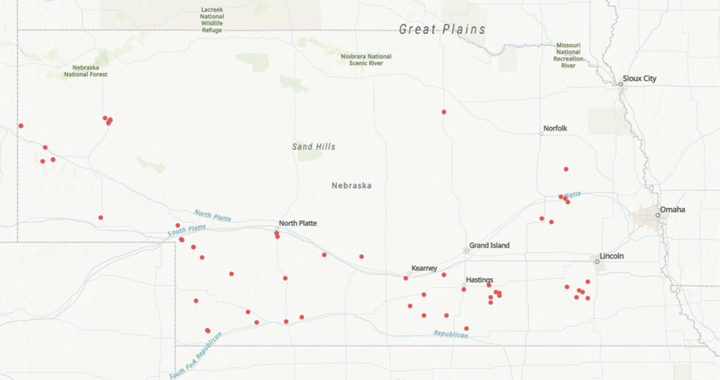
A total of 57 trapping locations were established in 24 Nebraska counties: Adams, Butler, Box Butte, Chase, Cheyenne, Clay, Colfax, Dawson, Dundy, Franklin, Frontier, Gage, Hitchcock, Holt, Kearney, Landcaster, Lincoln, Perkins, Polk, Red Willow, Saline, Scotts Bluff, Sioux and Webster counties in Nebraska (Figure 3).
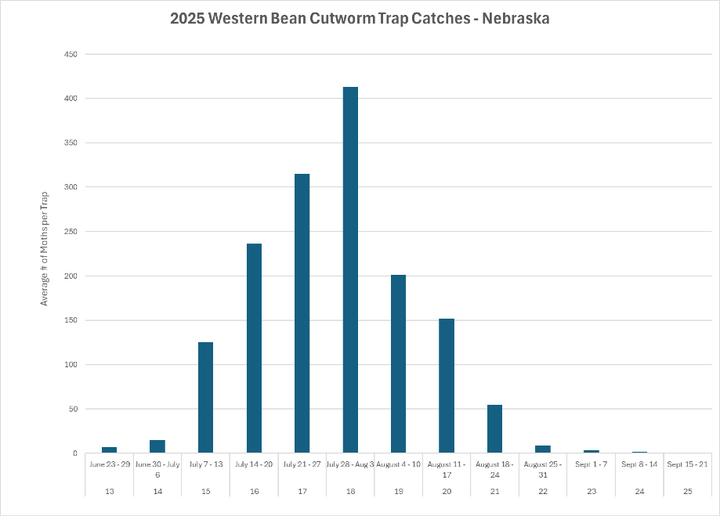
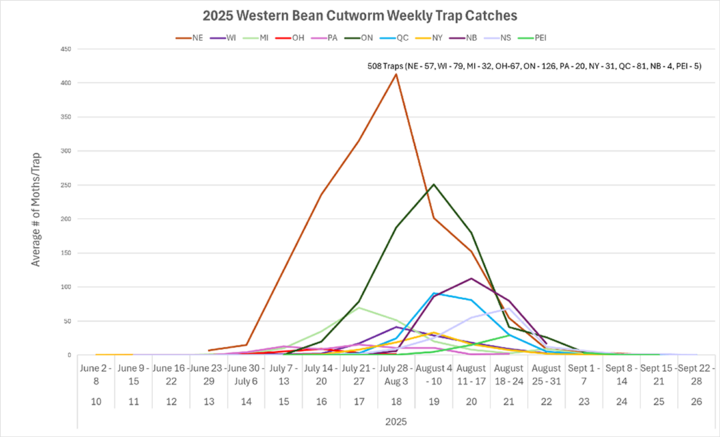
WBC were first collected the week of June 23-29, with average flights across the entire state peaking during the week from July 28-Aug. 3 with over 400 moths/trap/week (Figure 4). However, when looking site by site, the earliest peak in flight was in Colfax and Hitchcock counties with 291 and 96 moths/trap/week from July 7-13 and the latest peak flights were from Aug. 11-17 in Perkins County with 1,016 moths/trap/week and Scotts Bluff County with 173-183 moths/trap/week (Table 1).
Sampling Period | ||||||||||||||
County | Jun 23-29 | Jun 30-Jul 6 | Jul 7-13 | Jul 14-20 | Jul 21-27 | Jul 28-Aug 3 | Aug 4-10 | Aug 11-17 | Aug 18-24 | Aug 24-31 | Sep 1-7 | Sep 8-14 | Sep 15-21 | Sep 22-28 |
Field Corn | ||||||||||||||
Adams | 2 | 6 | 156 | 165 | 63 | 16 | - | - | - | 0 | - | - | - | - |
Box Butte | - | - | 1 | 11 | 659 | 1318 | 356 | 334 | - | 40 | 10 | - | 5 | - |
Butler | 3 | 11 | 117 | 110 | 353 | 16 | 9 | 3 | 1 | - | 2 | - | - | - |
Chase | - | 1 | 17 | 565 | 1045 | 594 | 70 | 49 | 3 | - | 2 | - | - | - |
Cheyenne | - | - | - | 42 | 285 | 284 | - | 128 | - | 38 | - | - | - | - |
Clay | 14 | 15 | 323 | 437 | 213 | - | - | - | - | - | - | - | - | - |
Colfax | 7 | 41 | 196 | 104 | 242 | 193 | 11 | 4 | 2 | - | 1 | - | - | - |
Dawson | - | - | 193 | 565 | 575 | - | - | - | - | - | - | - | - | - |
Franklin | 0 | 0 | 184 | 363 | 498 | 20 | - | - | - | - | - | - | - | - |
Frontier | - | 13 | 95 | 449 | 285 | - | 344 | 122 | - | 6 | - | - | - | - |
Gage | - | - | - | 99 | 189 | 173 | 27 | 6 | - | - | - | - | - | - |
Hayes | - | - | 151 | 205 | - | 902 | - | - | - | 96 | - | - | - | - |
Hitchcock | - | 4 | 72 | 64 | 50 | - | 26 | 18 | - | - | - | - | - | - |
Holt | - | - | - | - | - | 92 | - | - | - | - | - | - | - | - |
Kearney | 2 | 159 | 410 | 652 | 257 | 7 | - | - | - | - | - | - | - | - |
Keith | - | 1 | 9 | 155 | 494 | 900 | 760 | 433 | 231 | - | - | 11 | 0 | 0 |
Lancaster | - | - | - | 155 | 138 | 119 | 28 | 0 | - | - | - | - | - | - |
Lincoln | - | 2 | 36 | 299 | 438 | 525 | 156 | 42 | 0 | 6 | 0 | 1 | 0 | 0 |
Perkins | 2 | 0 | 5 | 565 | 1316 | 1460 | 642 | 447 | 102 | - | 36 | 0 | - | - |
Polk | 14 | 10 | 54 | - | 566 | - | 26 | 2 | - | - | 0 | - | - | - |
Red Willow | - | 21 | 219 | 289 | 158 | 33 | 75 | 10 | - | - | - | - | - | - |
Saline | - | - | - | 97 | 117 | 89 | 22 | 3 | - | - | - | - | - | - |
Scotts Bluff | 1 | 7 | 81 | 222 | 275 | 349 | 307 | 110 | 0 | 26 | 2 | 5 | 2 | - |
Webster | 1 | 25 | 235 | 333 | 582 | 101 | - | - | - | - | - | - | - | - |
Dry Beans | ||||||||||||||
Box Butte | - | - | 1 | 2 | 179 | 1017 | 341 | 450 | - | 64 | 18 | - | 3 | - |
Dundy | - | 4 | 98 | 897 | 1085 | 699 | 194 | 187 | 17 | - | 8 | 2 | - | - |
Perkins | - | - | 18 | 195 | 899 | 1694 | 797 | 902 | 82 | - | 11 | 0 | - | - |
Scotts Bluff | - | 1 | 15 | 67 | 121 | 117 | 175 | 115 | 0 | 29 | 18 | 5 | 2 | - |
Sioux | - | 1 | 2 | 29 | 126 | 394 | 83 | 66 | 0 | 22 | 12 | 4 | 0 | - |
Beyond Nebraska, 10 additional states and provinces trapped WBC in 2025; however, Nebraska had the highest trapping numbers and peak flights at slightly earlier dates than the other locations in 2025 (Figure 5).
European Corn Borer
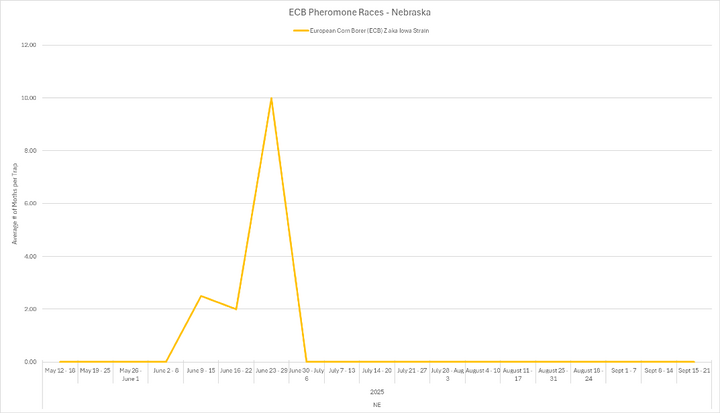
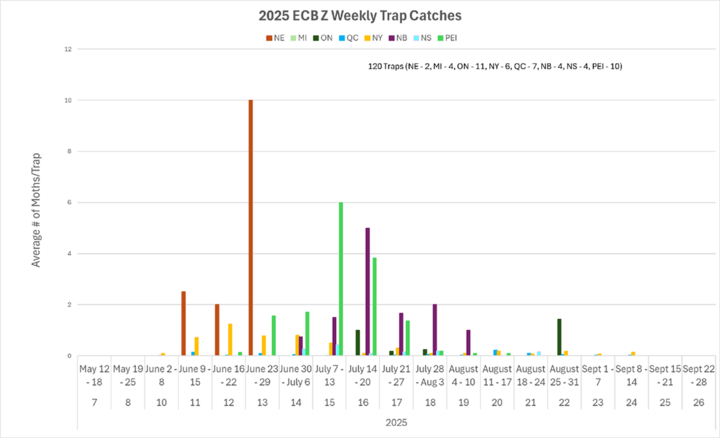
Two trapping locations were established for European corn borer in Lincoln and Keith counties in Nebraska in 2025. Lures to attract only the Z strain of ECB (also known as the “corn strain” — the genetic strain of ECB that dominates Nebraska) were used. European corn borer were first collected in Nebraska the week of June 9-15, and peaked from June 23-29, with an average of 10 moths/trap/week (Figure 6). Nebraska had the highest weekly average of ECB collected compared to the other trapping states/provinces (Figure 7).
Looking Forward to 2026
- Bookmark the GLMPMN website so that you can view real-time data on moth flights during the 2026 growing season.
- Join our trapping efforts and contribute your own pheromone trap data to this website. Contact Samantha and Silvana to join the network.
- To review interactive maps and details on trap locations from 2025, visit the Great Lakes and Maritimes Pest Monitoring Network.
