The Climate Prediction Center (CPC) issued their first La Niña alert July 8 and called for a 65% chance of La Niña formation during this upcoming fall period. Furthermore, CPC’s forecast indicates La Niña conditions will continue through the end of this upcoming winter. CPC issued an updated alert on Aug. 12 that increased their probability odds to 70 percent and continued to forecast the event lasting through the winter period.
La Nina conditions began to develop during the second half of last summer and the event strengthened into a moderate event by CPC standards. By the end of last December the eastern Equatorial Pacific began to warm, which signaled that the event had begun to weaken. By the end of April, La Niña conditions had ended as sea surface temperature (SST) anomalies warmed into neutral territory. The eastern Equatorial Pacific moved to above normal SST’s, while the central Equatorial Pacific still continued to display cooling, but not strong enough to meet La Niña conditions.
Since early July, the central Equatorial Pacific has displayed a cooling trend, while further east above normal SST’s still currently persist as of Aug. 18 (Figure 1). A year ago, below normal SST’s were beginning to spread westward from the eastern Equatorial Pacific (Figure 2). Support from this pattern came from upwelling currents along the coast of Peru and a channel of below normal temperature anomalies underneath the surface that had been moving eastward from the western Equatorial Pacific since late winter.
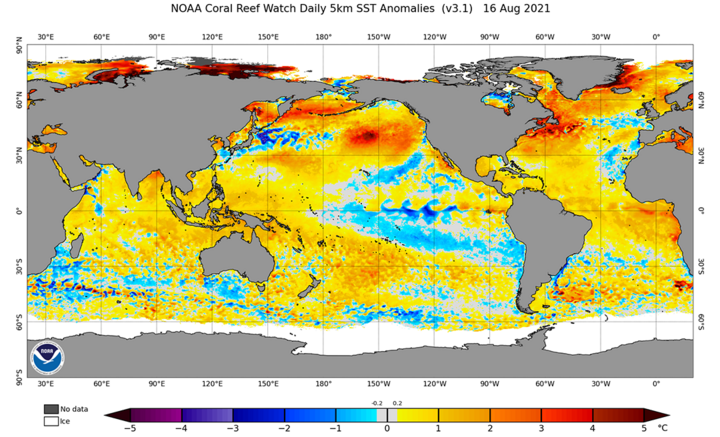
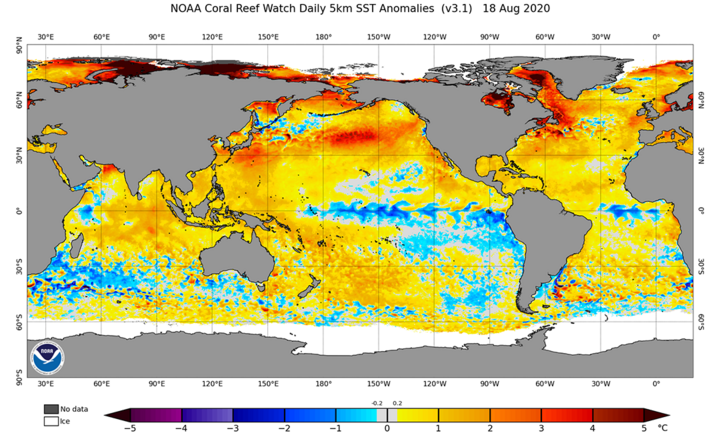
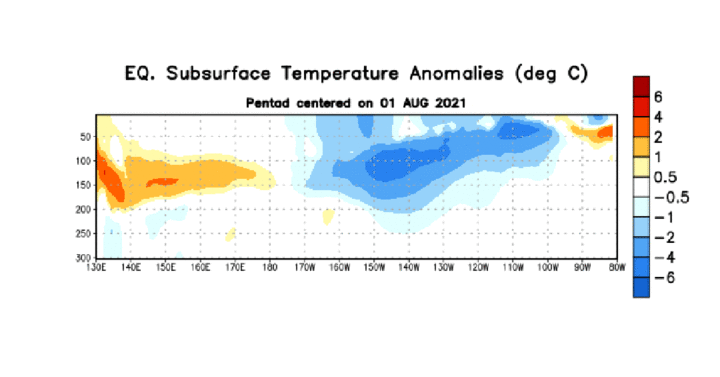
There are subtle differences between last year and this year in regards to SST anomalies. First, strong upwelling was occurring along the coast of Peru last year and that is currently absent, but appears to be trying to develop. Second, the upwelling is occurring much further west than normal, which is allowing the warm anomalies in the eastern Equatorial Pacific to persist. Third, the return current under the Equatorial Pacific (water moves west to east) is above normal in the west and below normal in the east (Figure 3). Last year at this time there was a solid channel of below normal temperature anomalies below the surface from Australia to Peru.
You will notice that Figure 3 is the sub-surface Pacific Equatorial heat content as of Aug. 1. When looking at the most current animation of this region on CPC’s website, the western warm pool anomaly has now expanded to cover the western half of the basin. The cold pool depicted in Figure 3 is now being forced to the surface and has shrunk in areal extent. Unless deep upwelling begins along the coast of Peru, the development of La Niña conditions will be slow with little support for more than a weak event materializing.
In order to be classified as a La Niña event, CPC requires that the central Equatorial Pacific SST anomalies must be -0.5 C or colder for five consecutive three-month rolling averages. CPC’s alert is based upon their consolidated indicators and forecast that this criteria will be met from the August-October through the December-February periods (Figure 4 — blue line). The average of the dynamical models also hit La Niña conditions in their forecast, but it only lasts four consecutive three-month periods (September-November through December-February). The statistical based models (green line) stay on the cool side of normal, but never reach the -0.5 C threshold required to be classified as a La Niña event.
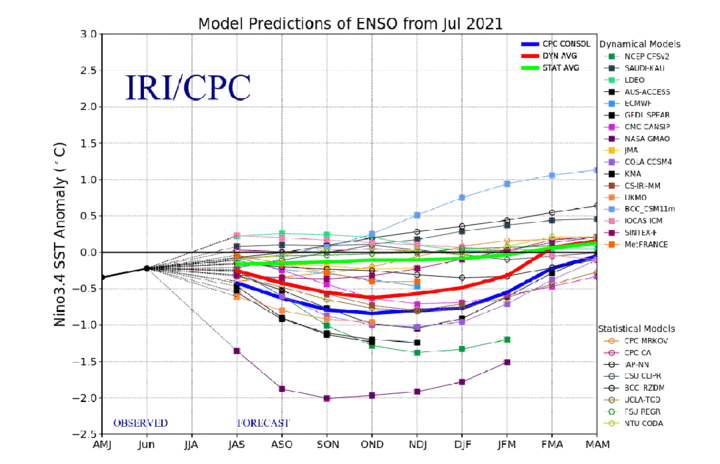
In fact, CPC’s La Niña alert does indicate that if La Niña conditions develop, it will be weak with SST anomalies forecast to be in the -0.5 to -0.7 C range (-0.5 C is the beginning threshold temperature for La Nina conditions). Last year, the SST anomalies peaked out at -1.8 C, which was only 0.2 C warmer than would be need to be classified as a strong event. In short, even with La Niña conditions forecast to develop through the end of the year, current data and model forecasts indicate that this event will barely qualify as a weak La Niña.
Fall Climate Outlook
During the fall of a building La Niña event, the northern and central High Plains region has a tendency toward warmer and drier than normal conditions. The stronger the event, the more likely that these conditions will develop. After battling drought conditions for the last 15 months, a dry fall would be concerning in regards to soil moisture accumulation in preparation for the 2022 growing season.
Most of the areas within the state that are currently battling drought conditions had below normal precipitation from last September through this April. Subsequently, soil moisture reserves were also below normal at the start of May for these locations after last summer’s drought development stripped soil profiles of available moisture in the top four feet of the soil profile. Therefore, a drier than normal fall will keep drought prospects elevated for 2022 barring an exceptionally wet late winter and spring period.
With weak La Niña conditions forecast this fall through the end of winter by the CPC, we may experience a more active weather pattern than last fall when precipitation events were far and few between during October and November. What will determine whether a more active weather pattern this fall and winter develops will be the strength of the western U.S. upper air ridge, the strength of upper air troughs ejecting out of the Gulf of Alaska and whether troughs entering the western U.S. get deflected into Canada or are able to move eastward across the northern half of the country.
The western United States upper air ridge is weaker this summer compared to 2020 and the monsoon season has been unusually strong. This moisture has resulted in widespread flash flooding issues from Arizona northward into northern Nevada and Utah, which should translate into a weaker ridging pattern over western United States. Although the upper air ridge has built northward into southwestern Canada multiple times this summer, it has not blocked the movement of upper air troughs into the Pacific Northwest that occurred in 2020. Last summer, these trough were pushed into western Canada along the ridge periphery and eventually southeastward into the Great Lakes and northeastern United States.
The official fall outlook for temperatures and precipitation was released Aug. 19 and does appear to place more emphasis on dryness and above normal temperatures across the southwestern ¼ of the country (Figures 5 and 6). Probabilities for above normal temperatures across the northern Plains is significantly weaker than CPC’s spring and summer outlooks which focused on dryness and warmth across the northwest quarter of the U.S., including Nebraska. This signifies to me that CPC is placing more emphasis on the northern jet stream and less on the southern jet stream, which is what would be expected during the onset of La Niña conditions.
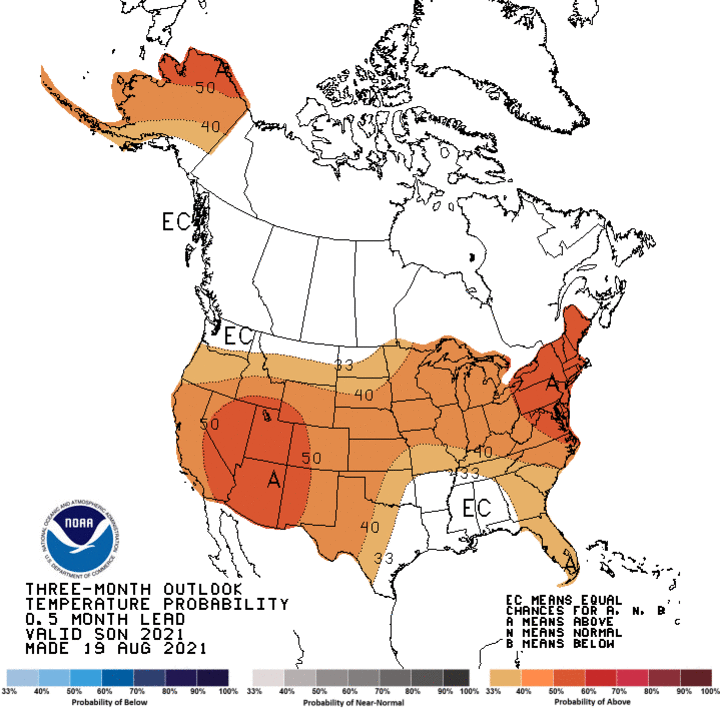

The dryness depicted in the fall outlook from CPC does indicate that there is a moderate likelihood of drier than normal conditions from the southwestern U.S. east-northeast through the western half of the central Plains. This area has been expanded northward about 250 miles and eastward approximately 100 miles from the July outlook for this fall. Since September accounts for 50-60% of our fall moisture (location dependent), it will likely determine whether this fall is drier than normal.
It has been a strong monsoon season in the southwestern U.S. and this moisture has reached as far northward as southern Idaho during the past month. Upper air troughs moving across the northern Rockies has been able to tap this moisture source and localized flooding from thunderstorm activity has occurred. More importantly, this moisture is helping to weaken the upper air ridge, making it more likely that systems entering the Pacific Northwest will be able to dig much further south than last fall. This would also increase the chance that these systems more effectively pull Gulf of Mexico moisture northward into the central and northern Plains once the troughs move east of the Rockies.
In my opinion, until the Equatorial Pacific firmly moves into La Nina conditions, the dry and warm fall conditions commonly associated with these events may be slower to materialize. CPC indicates that the second half of the fall period will be likely transition point for La Niña conditions, so I would lean toward the mid-October through the end of November as having the highest probabilities for warmth and dryness.
Soil Moisture Recharge and Drought Risk
If the monsoon moisture that has resulted in significant flash flood issues for the southern half of the Great Basin continues into September and interacts with upper air troughs penetrating farther southward into the Pacific Northwest than last summer, it should result in a more favorable precipitation pattern for the northern Rockies eastward into the upper Mississippi River valley this fall. Don’t expect that the drought signal will disappear before winter sets in across the Dakotas, but in order for this drought to end, normal soil moisture recharge will need to materialize this fall through next spring.
At the same time, the upper air pattern needs to consistently favor the northern stream, unlike last fall and winter when troughs moving into the Pacific Northwest broke from the northern stream and drifted southeast. These pieces of energy eventually were pulled eastward across the southern Plains by the subtropical jet stream resulting in above normal moisture at the expense of the northern Plains. During a typical La Niña late fall and winter, these storms usually move across the northern half of the country bypassing the southern Plains, which often leads to drought formation from southern Texas northward through the southern half of Kanas.
A key issue for Nebraska agricultural interests going into the fall and early winter period will be whether the northern jet stream becomes the dominate weather mechanism or if storms follow last winter’s lead and move though the southern stream and bypass the northern Plains once again. Although everyone would like perfect harvest weather, a lack of occasional moisture events that lead to periodic harvest delays just increases the likelihood that drought conditions will continue into the 2022 growing season due to inadequate soil moisture recharge.
Keeping track of the moisture that falls from late September through the end of April can give you a good idea of how much soil moisture is available to supplement natural rainfall when crops are actively growing. Soil moisture modeling research done in the early 1990s by the High Plains Regional Climate Center found that the effective infiltration rate of accumulated precipitation was between 65 and 75% (highest east). Multiply your accumulated moisture from the time a crop field reaches maturity by 70% (0.70) to get a good estimate of stored soil moisture as the calendar marches toward spring planting. By knowing how much water a crop needs under average conditions, you can subtract the stored soil moisture from crop water needs to get a rough idea of how much rainfall you will need to produce an average crop.
