A Dry August
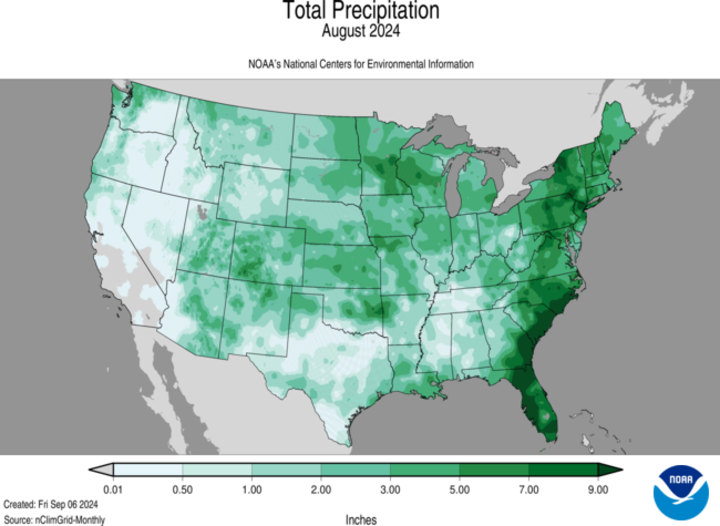
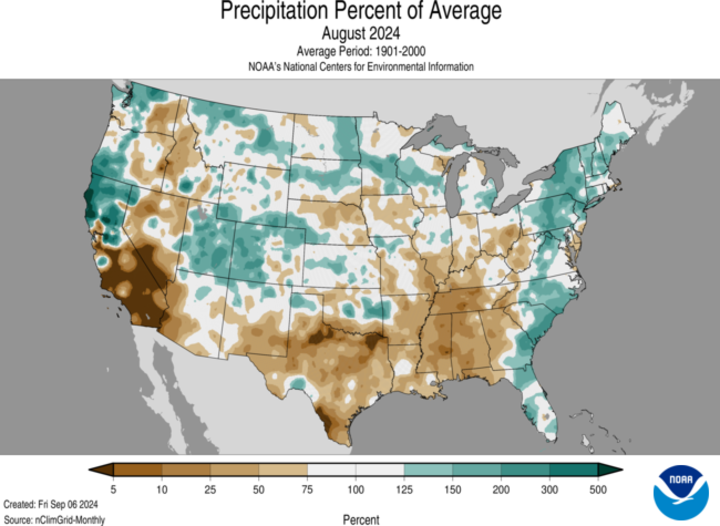
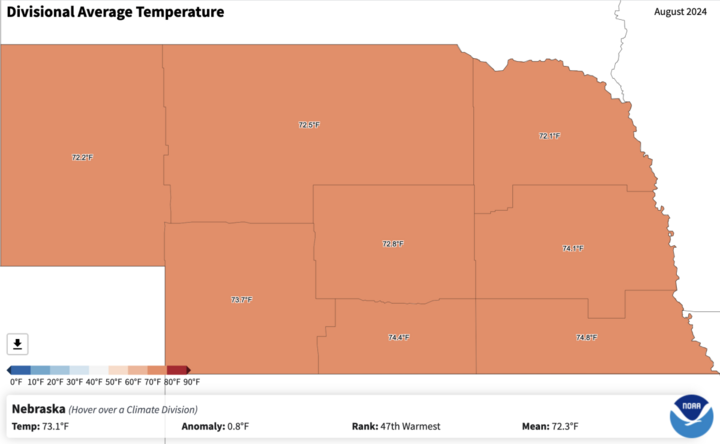
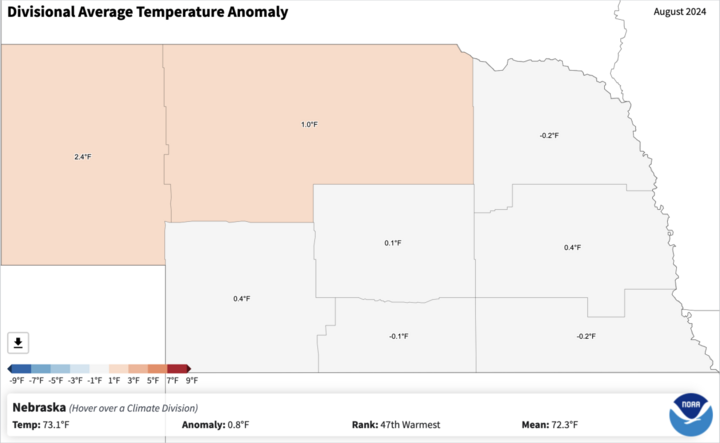
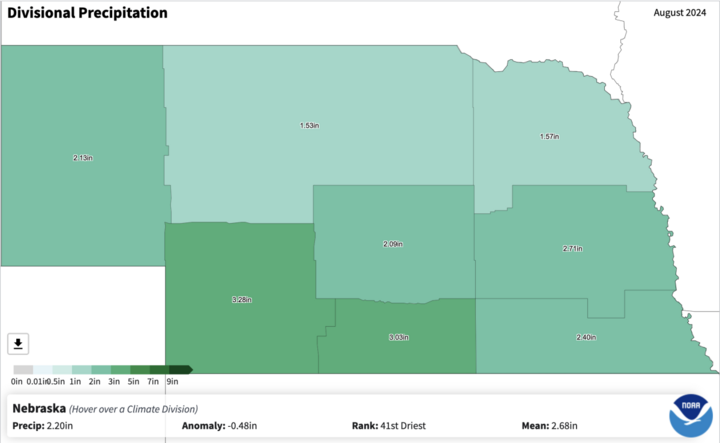
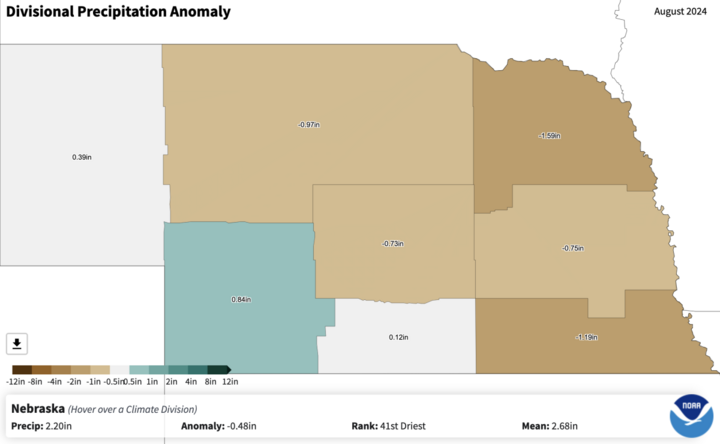
August was a dry month for most of Nebraska, particularly in the northern and eastern parts. Average temperatures for the state hovered around 72.3ºF, with a maximum average of 85.8ºF, and average total precipitation was about 2.20 inches. Temperatures were only about 0.5ºF less than usual for maximum temperatures but precipitation was 0.63-inch lower than the 1901–2000 mean. This qualifies for 41st driest on record.
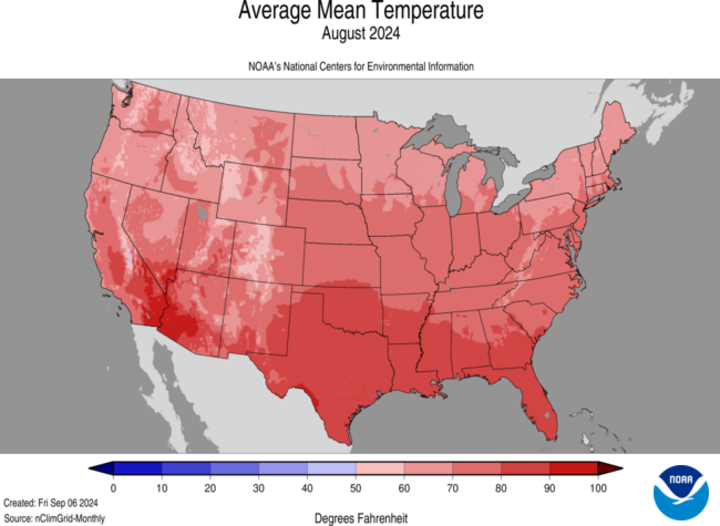
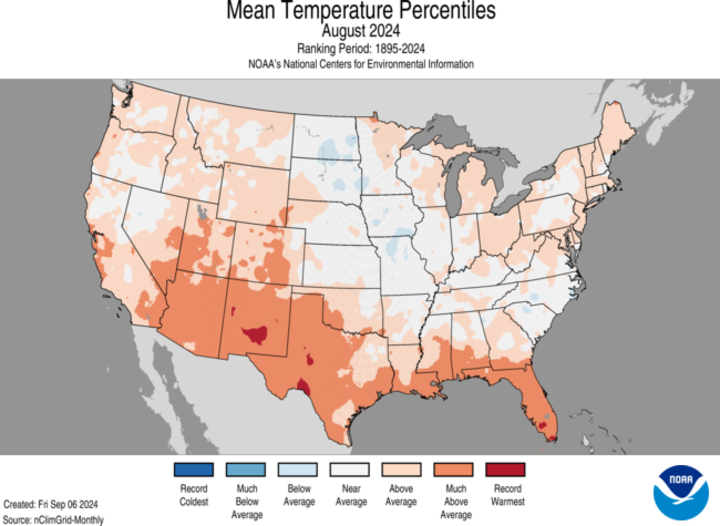
The warmer and drier conditions were most prominent in parts of north-central and eastern Nebraska, though the highest temperatures were confined to the northern Panhandle where drought is most severe. While it was warmer during the beginning and end of the month, the middle of the month was cooler than average. Furthermore, there was a seven-day stretch of near record cool temperatures between Aug. 7 and Aug. 13 but were quickly followed the next week by triple-digit heat and/or excessive heat indices for a major part of Nebraska on Aug. 25 and Aug. 26. Overall temperatures were around the long-term average for August.
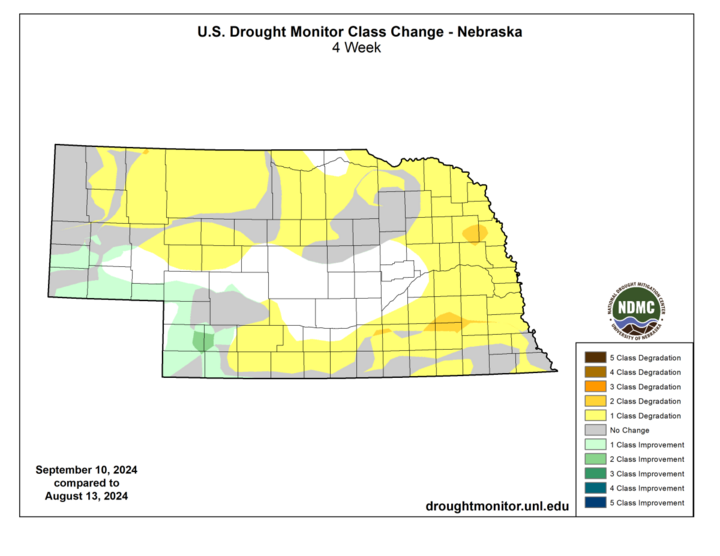
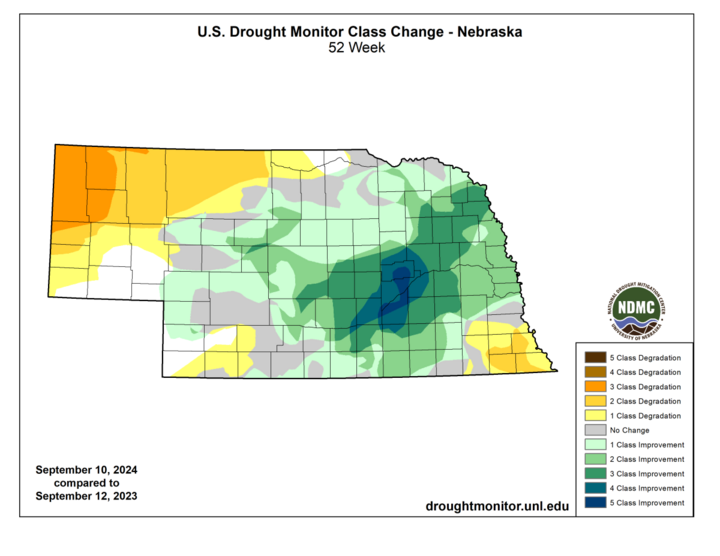
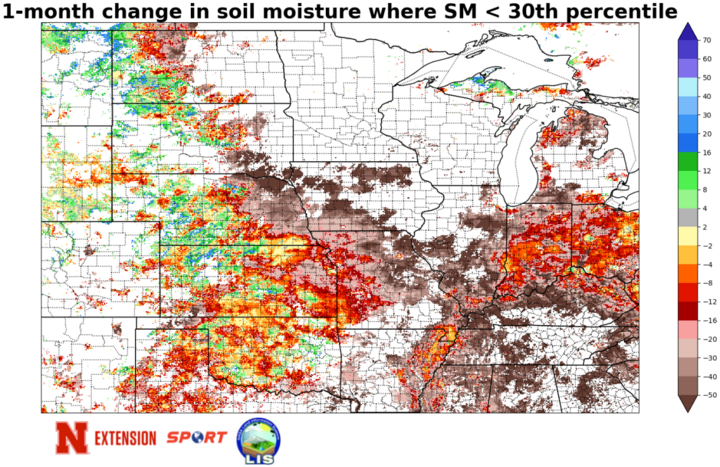
Drought improvement for southwestern Nebraska but degradation elsewhere abnormal dryness was introduced to several new areas throughout north-central and eastern Nebraska. We saw drought intensify in the northwestern Sandhills and in parts of southeastern Nebraska, with some areas seeing 2-category degradations on the U.S. Drought Monitor. However, drought improved across much of the southern Panhandle and southwestern Nebraska. Ridging that resulted in drier, warmer conditions for much of the southwestern U.S. put more southwestern areas in a favorable spot for picking up much needed rain and thunderstorms. This resulted in an improvement in soil moisture and vegetation health in the southern Panhandle and southwestern Nebraska. While most of eastern Nebraska was quite dry, roughly less than 50% of normal precipitation, there were areas that picked up significant precipitation. Areas around Omaha in particular received enough precipitation to avoid going into abnormal dryness before the month’s end.
Extremes and Tabular Summaries
- Maximum Daily High Temperature: 107ºF, Springview 2NW and Purdum
- Minimum Daily High Temperature: 54ºF, Bushnell 15S
- Maximum Daily Low Temperature: 78ºF, Crete 4ESE
- Minimum Daily Low Temperature: 34ºF, Agate 3 E and Harrison 20 SSE
- Maximum Monthly Precipitation: 8.24 inches, Chalco 2.4 NNW
