Key Takeaways
Irrigation needs were limited in 2025: Seasonal irrigation required to minimize water stress ranged from 3.75 to 5.6 inches in a silt loam soil near Clay Center.
Tools recommended different irrigation amounts: Watermark sensors at 60 cb recommended 5.6 inches, while AquaSpy and CropFit recommended 3.75 inches, with no significant yield differences among tools.
Local rainfall data improves accuracy: Pair or manually enter data from a local rain gauge when using soil water balance tools.
Tool choice can be practical: Water balance and soil moisture sensor approaches both provided reasonable irrigation estimates, so growers can choose based on convenience, cost, labor and user interface.
Suggestions for 2026
Seasonal forecasts suggest precipitation may be low or come late in much of central to western Nebraska. Following the exceptionally dry spring, much of Nebraska has already started irrigating or is getting prepared for early irrigation in 2026.
Early installation of soil moisture sensors may be advisable to diagnose any need for earlier-than-usual irrigation due to the dry spring.
Slightly cutting back on irrigation applied from a 60cb irrigation trigger with Watermark sensors may be a good way to save water and reduce potential for leaching while maintaining near maximum yields. These results suggest a cutback of about 10% if the summer rains are low, and up to 33% if the summer rains are higher.
Considering the dry conditions, early season irrigation at the 60cb level may minimize yield loss. If rain does increase later in the season as some predictions suggest, adjusting irrigation volumes may be worthwhile. This could be done by cutting back on irrigation depths in each application by as much as 33% or irrigating at a lower moisture level of 80cb.
Groundwater Rules in South-Central Nebraska
Across south-central Nebraska, declining groundwater levels have been a concern for NRDs, some of which have water allocation rules when groundwater decline reaches pre-determined levels.
In 2025, the Little Blue NRD entered mandatory groundwater allocations, limiting use of water for irrigation to 65 acre-inches over a five-year period and implementing a pause on new high-capacity wells.
In the neighboring Upper Big Blue NRD, groundwater levels have been below the historic reference level most years since 2000 and being monitored for a potential trigger of water allocation.
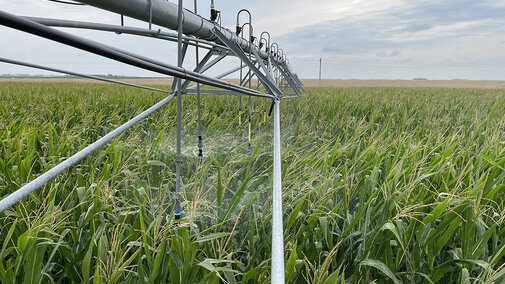
Field Study: Comparing Various Irrigation Scheduling Methods
Beginning in 2024, UNL initiated a study at South Central Agriculture Lab (SCAL) to support local NRDs in assessing the efficacy of irrigation scheduling tools. The goal of the assessment was to identify tools that help maximize yields and economic returns from irrigation within existing or potential water allocation limits. The results of the 2024 season were shared in a previous CropWatch article, and UNL conducted additional trials in 2025. The study compared readily available scheduling tools that represent two of the main scheduling approaches: soil moisture monitoring and soil water balance accounting. For producers, the key question is whether these tools can help reduce irrigation water use without sacrificing yield.
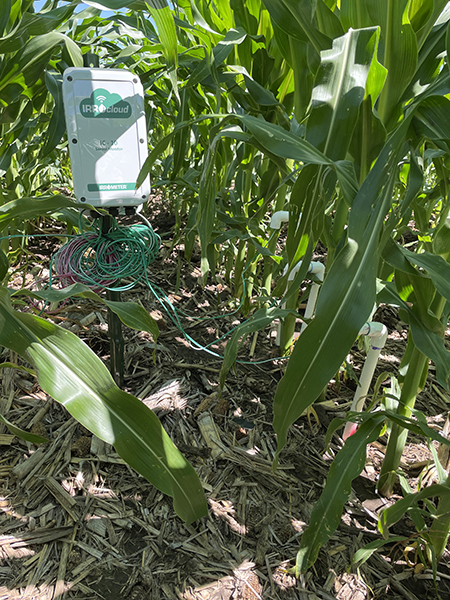
Method 1 — Soil Moisture Monitoring
Two soil moisture sensors were used in 2025:
- Watermark sensors were installed at 1, 2 and 3 feet and connected to Irrometer’s remote monitoring device (IC-10). Irrigation decisions were made based on average soil tension readings of the three sensors.
- An AquaSpy probe was installed in one plot, with irrigation decisions made based on AquaSpy’s recommended irrigation dates.
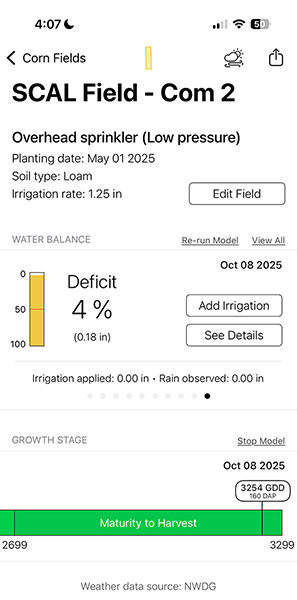
Method 2 — Water Balance Accounting
The water balance accounting was scheduled using CropFit, a free app developed at the University of Georgia. This app calculates a soil-water balance based on local or gridded weather data and user-inputs for irrigation amounts and dates. The tool alerts users when minimum allowable depletion levels are reached and irrigation is recommended.
Comparing Full and Deficit Irrigation Levels
Under each scheduling method, a full and deficit irrigation level was tested. The full Watermark irrigation level serves as a benchmark for a non-water limited treatment, above which additional water is not expected to result in additional yield. The deficit Watermark irrigation and water balance methods were compared to this benchmark to identify differences in the amount of water applied and yield that resulted.
| Scheduling Type | Scheduling Method | Irrigation Level |
|---|---|---|
| Sensor | Watermark Full Irrigation | Irrigation triggered at 60cb |
| Sensor | Watermark Deficit Irrigation | Irrigation triggered at 80cb |
| Sensor | AquaSpy Full Irrigation | Standard recommendation as provided by system |
| Water Balance | CropFit Full Irrigation | 50% soil water depletion |
| Water Balance | CropFit Deficit Irrigation | 66% soil water depletion |
Management Details
Corn (Dekalb DKC61-40RIB) was planted on May 2, 2025 at a rate of 32,100 seeds per acre. 220 lb-N/acre was applied as UAN 32-0-0 in April, and harvest occurred on Oct. 13, 2025. All yields were normalized to 15.5% grain moisture.
Results
Seasonal Weather
In 2025, precipitation was above average, with low rainfall from late June through late July (about 2 inches) and high rainfall from late July to end of August (about 8.25 inches), resulting in about 20.5 inches overall during the crop season. Despite the higher precipitation, yields were lower in 2025. The lower yields were likely due to lower solar radiation and higher night temperatures as discussed in this CropWatch article.
Irrigation Amounts and Yields
The fully irrigated Watermark treatment provided the greatest irrigation depth across scheduling methods (5.6 inches). Although this amount was 1.9 inches more than the CropFit Full Irrigation method, it did not produce a significant difference in yield.
The other soil moisture sensor (AquaSpy) applied close to the same amount of irrigation water as the CropFit Full Irrigation and produced similar yields.
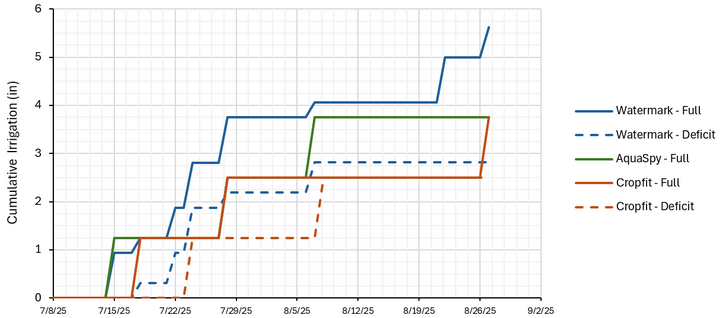
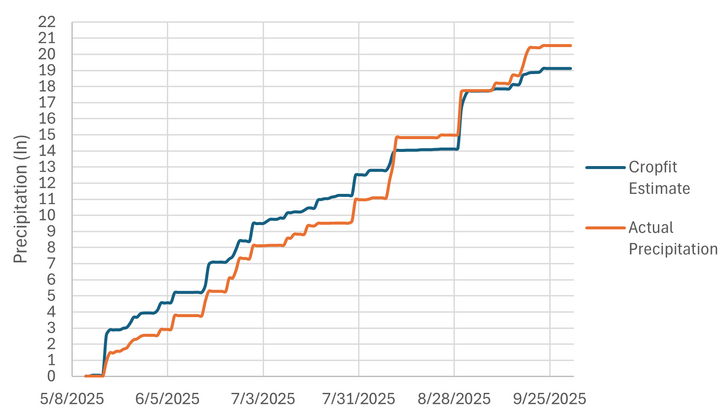
Although the AquaSpy method applied a similar amount of total irrigation as the CropFit Full Irrigation method, the timing of the AquaSpy irrigation differed. AquaSpy applied the last irrigation on Aug. 5, much earlier than CropFit Full Irrigation, which applied the last irrigation on Aug. 27 and did not irrigate at all between July 28 and Aug. 27. This reflected a pattern in which CropFit overestimated precipitation through about Aug. 10 and then underestimated precipitation afterward.
One reason that CropFit’s water balance method applied less irrigation water than the Watermark sensors under full irrigation is that the CropFit app was set to use nationally gridded weather, which is not as accurate as an on-site weather station. CropFit’s estimates of precipitation were almost two inches more than the actual precipitation recorded from a weather station on site at the start of the irrigation period (mid-July). This led the water balance (CropFit) scheduling to start irrigation later and apply less overall water before precipitation resumed heavily again in August.
Although this study didn’t use it, the CropFit app allows users to connect to their own local weather station if they have one. These results suggest that connecting a local weather station may improve the app’s irrigation triggers and ultimately raise yields.
Under deficit irrigation, we see a different pattern. Deficit irrigated yields with the CropFit and Watermark applied very similar volumes of irrigation (Watermark applied 0.3 inches more irrigation than CropFit) and had very similar yields (1 bu/ac difference).
Overall, there was no statistically significant yield difference between fully irrigated versus deficit irrigated plots. Despite this, deficit irrigation cut down on irrigation by 50% when using Watermark moisture sensors and by 33% when using CropFit.
| Scheduling Method | Avg. Yield | Avg. Irrigation |
| Dryland | 162 | 0 |
| Watermark Full | 212 | 5.6 |
| Watermark Deficit | 199 | 2.8 |
| AquaSpy | 207 | 3.75 |
| CropFit Full | 204 | 3.7 |
| CropFit Deficit | 198 | 2.5 |
| * Pr(>F) 0.17 (ns) (test does not include dryland reference) | ||
Choosing a Scheduling Tool — Sensors or Water Balance?
When selecting a scheduling tool, it is important to understand what each tool is doing and how this could impact accuracy. Soil moisture sensors such as Watermark measure prevailing water status from a particular point in the field. In order to make scheduling decisions, the user needs to decide how many sensors to install, at what depths, and whether to average the results.
In this study, we took the simple approach of averaging the sensor readings down to 3 feet. This encourages roots to extract water from deeper layers when the upper layers are dry. However, scheduling based on only shallower depths may result in different amounts of irrigation being scheduled. For more information in using Watermark sensors for irrigation scheduling, view CropWatch’s Weekly Irrigation Newsletter.
In contrast, scheduling using soil water balance services (like the app tested in this study) estimate soil water based on weather and user-entered irrigation data. The estimates of soil water depend highly on good data inputs, which requires users to closely monitor the tools’ estimates of weather and input the correct irrigation volumes. For best results, the user should pair a local rain gauge or manually correct the estimated rainfall in the tool based on the closest rainfall data available for the field.
This study suggests various scheduling tools can keep irrigation volumes within existing or potential water allocations for growers. Practical considerations such as cost and ease of use are important factors to guide which scheduling tool to use. While soil moisture sensors have been effective in producing the greatest yields without excess irrigation, using them most effectively also requires skilled installation, a subscription for monitoring data in real time, and close monitoring for sensor malfunction. The water balance approaches are most effective when coupled with a local weather station and run with site-specific soil data. However, once set up, these approaches are easy to use and do not require additional hardware.
In this study, we also saw that under deficit irrigation, yields and irrigation volumes were nearly identical between soil water balance accounting and soil sensing methods. Considering 2025 was a relatively wet year, more comparisons under much drier seasonal conditions will be valuable to compare these methods further.
