Key Takeaways
Full-season cover crops can improve soil health characteristics in the short term.
Providing game bird habitat and soil conservation can go hand in hand.
Introduction
In seed corn fields, pivot corners and isolation acres (areas to prevent cross pollination) are often planted to soybean. These areas could also be used to accomplish conservation goals, such as providing wildlife habitat. To this end, Pheasants Forever's Full Season Cover Crop Practices program pays producers to plant a specially designed cover crop in these acres.
The cover crops must be in the field from June 1 to March 15 the following year, providing cover and forage resources for pheasants, turkeys and other game bird species.
With the potential benefits of adding plant diversity and living roots, we wanted to explore whether these cover crops intended for game birds could also improve soil health characteristics. What we found was somewhat surprising. We often hear that soil health improvements with cover crops take a long time; however, we saw increases in soil organic carbon and biological activity in just 10 months.
The following article describes how we conducted the study and what producers can take away from it.
How Was the Study Conducted?
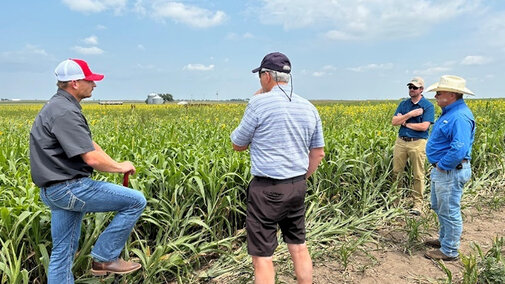
Four seed corn farmers in central Nebraska participated in this study. They planted a 10-species cover crop mix* at a seeding rate of 28 lb/ac into pivot corners and isolation areas of their seed corn fields.
Cover crops established well and grew to about 5 feet tall by August 2024. They were winter-killed, and residue remained standing until late March or April of 2025, when it was tilled into the soil.
Soil samples were collected on June 6, 2024, Aug. 22, 2024, and April 9, 2025, from cover-cropped and seed corn areas on each of the four farms participating in the study. For more information on the management of each farm, consult Table 1.
At each sampling time, four soil samples were taken in the cover crop and four in the seed corn, with each sample consisting of 10 soil cores taken to a depth of 8 inches. Soil samples were analyzed for soil nitrate and two soil health indicators, and results were statistically evaluated.**
*The cover crop mix consisted of dwarf forage sorghum, cereal rye, grain sorghum, buckwheat, flax, sunflower, forage radish, cowpeas, mung beans, and hairy vetch, seeded at 28 lb/ac. **Results were statistically evaluated with SAS9.4 as a repeated measures analysis with a significance level of 0.1. Treatment (cover crop or seed corn) and time (June, August and April) were fixed effects and time nested within farm were random effects. |
Soil Nitrate
Nitrogen (N), whether applied as fertilizer or inherent in the soil, is transformed by soil microbes into nitrate or ammonium before crops can use it. Nitrate is soluble in water whereas ammonium is not, making nitrate susceptible to run-off and leaching during rainfall or irrigation. Did cover crops decrease soil nitrate levels compared to seed corn acres?
The data shows large variations in soil nitrate concentrations throughout the year (see Figure 1), but whether that is due to the cover crop or differences in N fertilization is not clear.
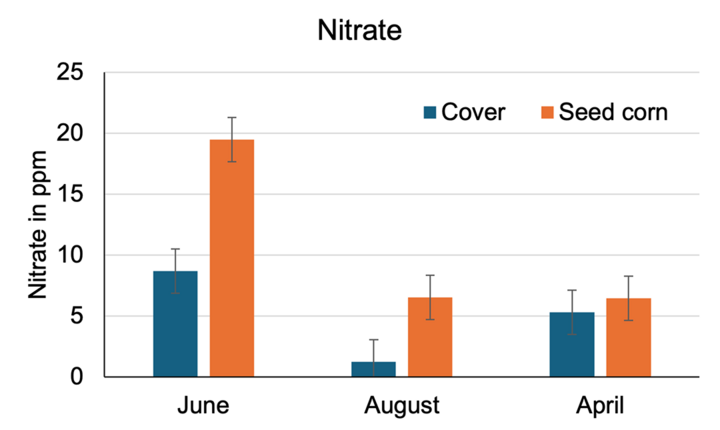
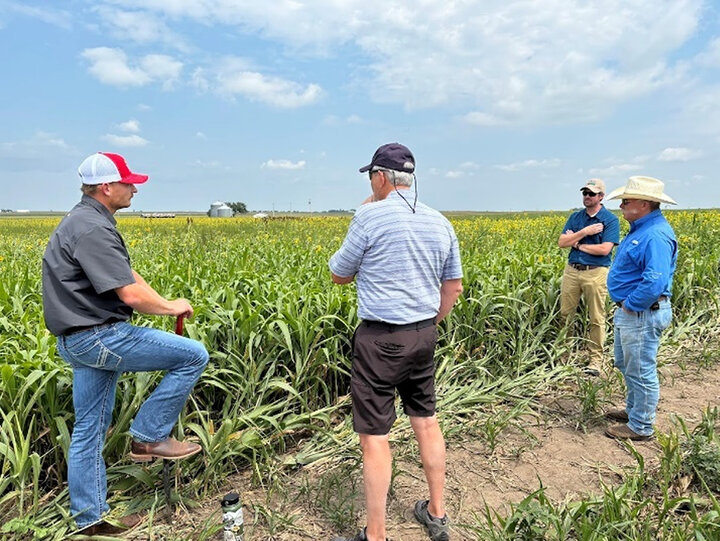
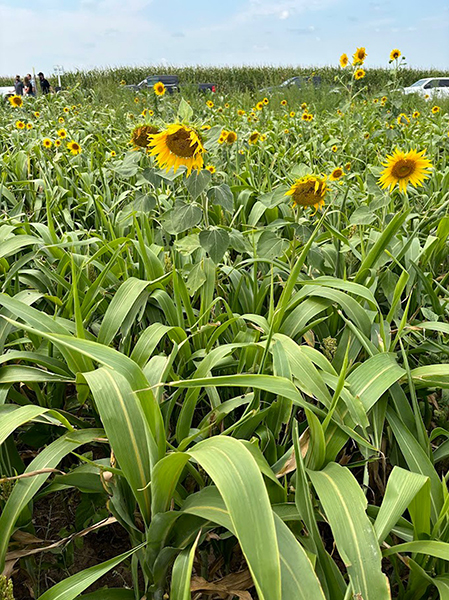
In June, soil nitrate concentrations in seed corn were considerably higher than in cover crops, reflecting the application of N fertilizer in seed corn fields (Table 1). Between June and August, seed corn and cover crops took up more than half the soil nitrate. The cover crop mix included heavy N feeders such as sorghum (Figures 2 and 3).
By April, nitrate concentrations were similar between the cover crop and seed corn areas, likely due to N being released from decomposing seed corn and cover crop residue, as well as N fertilization on some farms between October and April.
Soil Organic Carbon
Soil organic carbon is probably the most well-known indicator of soil health. It makes up about 58% of soil organic matter and is the main source of energy for soil microorganisms. Soils with more organic carbon can support more microbes, leading to better nutrient cycling, soil aggregation, water infiltration and other benefits.
Considering that plants add organic matter to the soil — in the form of residue and root exudates — does soil organic carbon increase under a full-season cover crop compared to seed corn fields?
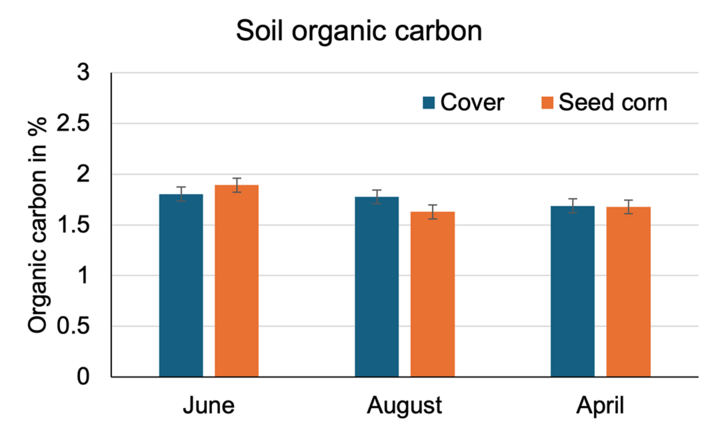
To explain the data, it makes most sense to look at soil organic carbon’s interaction with the sampling time. Soil organic carbon under the cover crop was similar at each sampling time, averaging 1.76% which is equivalent to about 3.03% of total organic matter (see Figure 4). Under seed corn, soil organic carbon varied with the highest level measured in June at 1.89% (equivalent to 3.26% organic matter).
When comparing the cover crop to seed corn, soil organic carbon under the cover crop was higher than under seed corn in August, but not at the other sampling times. Carbon inputs into the soil from vegetation were likely higher in August because the cover crops were growing actively.
Soil Respiration
As soil microbes feed on organic matter and reproduce, they respire CO2 just like other organisms. Measuring the amount of CO2 in a test called potential carbon mineralization (or soil respiration) can indicate the numbers and activity of soil microorganisms, which in turn can be a sign of how quickly residue breaks down and cycles nutrients back into the soil for crops to take up. Increasing the amount of microbial food sources — such as plant residue or root exudates released by actively growing plants — can lead to greater respiration. Temperature and moisture are also important factors in microbial growth, with soil respiration typically higher during the summer.
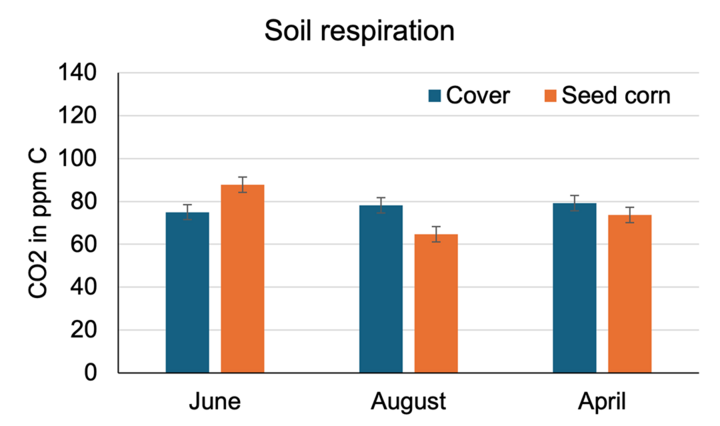
Did soil respiration increase due to the cover crop, time of sampling, or both? The answer is more complicated. The cover crop itself has an effect only when viewed in the context of its interaction with sampling time (see Figure 5). At the June sampling, respiration was lower under the cover crop than under seed corn. Actively growing seed corn provided a better food source and had more soil moisture than the cover crop, which was non-irrigated and where plants were still fairly small.
By August, soil respiration was higher under cover crops than under seed corn, reflecting better conditions for microbes. Soil organic carbon and soil respiration levels follow the same pattern, illustrating the interdependence of microorganisms on their food source.
Take-Home Message
A full-season cover crop designed for game birds shows promise to improve two important soil health characteristics — organic carbon and soil respiration — in the short-term. This could increase nutrient cycling, water infiltration, soil fertility and yields of subsequent crops. Follow-up studies are needed to verify long-term effects. If these soil health improvements lead to greater crop yields or reduced input costs, the full-season cover crop practice could become more appealing to farmers, especially if combined with the per acre payments or revenue from game bird hunting.
Acknowledgements
The authors would like to thank the farmers for their willingness to participate in this study. Funding sources include Nebraska Extension, USDA Natural Resources Conservation Service (NRCS), the Nebraska Environmental Trust, Syngenta, Nebraska Game and Parks, and the National Fish and Wildlife Foundation.
Management | County Locations of Farms | |||
Seward | York 1 | Polk | York 2 | |
Seed Corn Acres | ||||
| Seed corn planting | May 15, 2024 | April 23, 2024 | June 6, 2024 | June 10, 2024 |
| N applied April-August 2024 | 4 gallons of 6-24-6 as starter 110 lb/ac
| 120 lb/ac | 100 lb/ac | 105 lb/ac |
| Short-season cover crop | - | Turnips and radish, planted July 2024*, grazed | Cereal rye, planted September 2024 | Turnips and radish, planted July 2024*, grazed |
| Seed corn harvest | Sept. 20, 2024 | Aug. 22, 2024 | Oct. 1, 2024 | Sept. 10, 2024 |
| N applied October 2024 to April 2025 | 150 lb/ac | 120 lb/ac | - | - |
| Tillage | - | - | - | - |
Full-Season Cover Crop Acres | ||||
| Full season cover crop planting | June 6, 2024 | June 6, 2024 | June 12, 2024 | May 28, 2024 |
| N applied April-August | - | - | - | - |
| N applied October 2024 to April 2025 | 150 lb/ac | 120 lb/ac | - | - |
| Tillage | April 4, 2025 | April 1, 2025 | April 1, 2025 | - |
*planted when male rows are destroyed into remaining seed corn rows. Radish and turnips winterkill.
