January 31, 2014
Was 2013 a good, bad, or average year for corn yield across Nebraska?

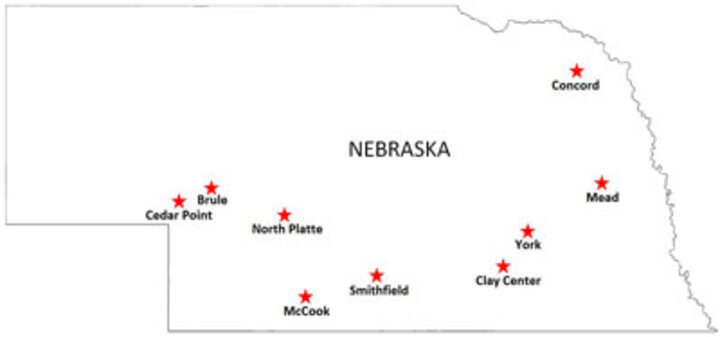
Figure 1. Locations of corn fields listed in Table 1.
To answer this question, we collected on-farm corn yield reports of both irrigated and rainfed fields at nine sites across the state (Figure 1). Based on the reported crop management data (including soil data) and weather data (from the High Plains Regional Climate Center), we used the Hybrid-Maize model to simulate corn yield potential at these fields for 2013. We also simulated their long-term average yields, assuming the same management practices as in 2013.
Simulated yield potential in 2013 was compared to actual yields and both values were compared with long-term average yield potential at these locations, based on simulations using weather data from the past 20-30 years. (See Tables 1.1 and 1.2 and note that length of past performance depends on how many years of weather data were available in the HPRCC database).
| Table 1.1 Reported on-farm irrigated corn yields and management information for 2013, and corresponding simulated 2013 yields and long-term average yields by the Hybrid-Maize. | |||||||
| Location | RM |
Planting Date |
Population, x 1000/ac |
Yield, bu/ac | |||
| Reported | Simulated |
Simulated Long-term Average |
|||||
| Concord | 108 | 5/16 | 36 | 263 | 258 | 246 | |
| Concord | 108 | 5/25 | 31 | 224 | 245 | 228 | |
| Mead | 115 | 4/29 | 34 | 251 | 255 | 238 | |
| York | 115 | 5/10 | 34 | 235 | 254 | 276 | |
| York | 114 | 4/27 | 32 | 244 | 253 | 266 | |
| York | 115 | 4/30 | 34 | 255 | 258 | 275 | |
| York | 109 | 5/10 | 32 | 233 | 241 | 246 | |
| Clay Center | 112 | 5/7 | 34 | 235 | 268 | 261 | |
| Clay Center | 114 | 5/10 | 34 | 255 | 243 | 241 | |
| Smithfield | 116 | 5/2 | 35 | 240 | 228 | 257 | |
| McCook* | 116 | 4/25 | 26 | 215 | 192 | 208 | |
| Brule* | 107 | 5/23 | 32 | 180 | 168 | 200 | |
| Cedar Point | 113 | 4/29 | 33 | 231 | 223 | 267 | |
| Cedar Point* | 111 | 5/2 | 34 | 253 | 194 | 224 | |
| * Cases of reported yield substaintally higher than model simulations | |||||||
| Table 1.2. Reported on-farm rainfed corn yields and management information for 2013, and corresponding simulated 2013 yields and long-term average yields by the Hybrid-Maize model. | |||||||
| Location | RM | Planting Date |
Population, x 1,000/ac |
Growing season rainfall**, inch |
Yield, bu/ac | ||
| Reported | Simulated |
Simulated Long-term Average |
|||||
| Concord | 109 | 5/16 | 25 | 13.5 | 169 | 175 | 154 |
| Mead* | 114 | 4/29 | 26 | 12.1 | 210 | 142 | 173 |
| Mead* | 107 | 5/13 | 25 | 10.5 | 165 | 146 | 164 |
| McCook | 113 | 5/8 | 15 | 4.9 | 32 | 48 | 123 |
| North Platte | 109 | 4/30 | 15 | 7.1 | 8 | 33 | 88 |
| Cedar Point | 97 | 5/25 | 15 | 8.6 | 42 | 80 | 64 |
| Cedar Point | 103 | 5/25 | 15 | 8.6 | 40 | 76 | 60 |
|
* Cases of reported yield substantially higher than model simulations. ** From date of planting to date of physiological maturity as estimated by the Hybrid-Maize model based on hybrid maturity rating and actual temperature. |
|||||||
The Hybrid-Maize model simulates yield potential, which is the yield that can be achieved under a specified sowing date, hybrid maturity, and plant population when other factors such as nutrients, weeds, insects, and disease are non-limiting. For irrigated systems, yield potential assumes water is not limiting. Rainfed yield potential is heavily influenced by the amount and timing of precipitation during the growing season. See the Hybrid-Maize User's Guide for more information about the model and how these simulations are performed.
How Did The Actual Corn Yields Compare To The Model Simulations?


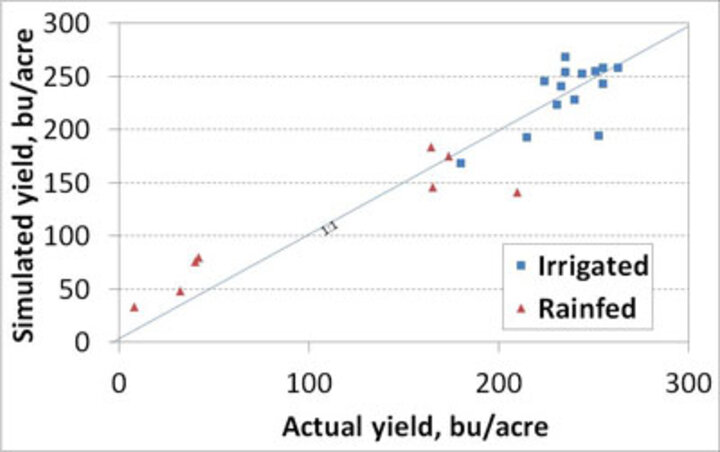
Figure 2. Comparison of reported corn yields with corresponding model simulations for fields listed in Table 1.
Reported yields for irrigated fields ranged from 180 to 263 bu/ac (Table 1.1). Reported rainfed yields were considerably more variable across the state, ranging from 8 bu/ac in the west (North Platte) to 210 bu/ac in the east (Mead) (Table 1.2). The low yield of rainfed fields in the west (North Platte and McCook) reflects the below-average rainfall (4.9 to 8.6 inches, respectively) during the growing season (Table 1.2). In addition, the 2012 drought across this region and subsequent lower residual soil moisture at the end of the 2012 growing season likely contributed to an overall water shortage for the 2013 growing season. Eastern Nebraska sites (Concord and Mead) received more normal rainfall during the growing season (10.5 to 13.5 inches), resulting in average to above-average corn yields under rainfed conditions (Table 1.2).
Based on the reported crop management information (Table 1) and weather data covering those areas, corn yields simulated by the Hybrid-Maize model agree reasonably well with the reported yields of both irrigated and rainfed fields across the wide range of observed yields (Figure 2). Typically, simulated yields are expected to be close to or higher than reported yields of well-managed fields because model simulations assume optimal crop management for nutrients, diseases, insects, and pests. There are, however, some cases where reported yields are more than 5% greater than simulated yields, including two rainfed fields in Mead and three irrigated fields in McCook, Cedar Point, and Brule (indicated by * in Tables 1.1 and 1.2).
For the two rainfed fields at Mead, model simulations suggest significant soil moisture shortage and thus significant water stress during part of the grain-filling period. This resulted in below-average yield potential of 142 and 146 bu/ac for these sites in 2013. The discrepancy between simulated and reported yield at these two rainfed sites might be due to one or more localized thunderstorms that did not occur at the nearest weather stations. Another contributing factor could be water run-on from adjacent land if fields are, on average, downhill from surrounding fields and landscapes.
The three "over-yielding" irrigated fields were all located in western Nebraska and we suspect that frequent irrigations to keep up with crop water demand may have cooled within-field air temperature. This may have led to the actual dates of maturity being later than predicted by model simulations based on temperature data at weather stations that are several miles away. For example, based on model simulations, the McCook and Cedar Point over-yielding fields would require about 12 inches of irrigation water. This would likely have required 10 to 12 irrigation cycles, mostly applied during the middle and later stages of the cropping season. This could have cooled field temperature.
For the simulated yield to match the reported yield of these two fields, it would require a delay of maturity by five days in McCook and 13 days in Cedar Point. We believe that further field research is warranted to investigate the impact on days to maturity from temperature lowering in corn fields due to irrigation as compared to temperatures at nearby weather stations. An accurate estimate of the length of time from silking to physiological maturity (also called black layer) is essential for simulating yield potential because a well-managed corn crop produces nearly 5 bu/ac for each day of grain filling.


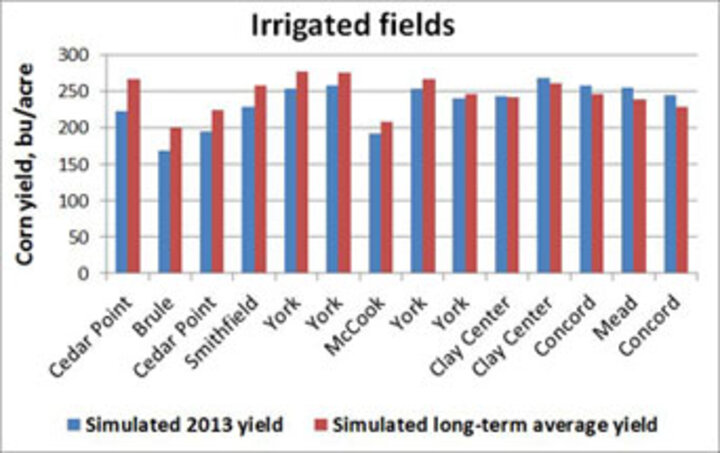
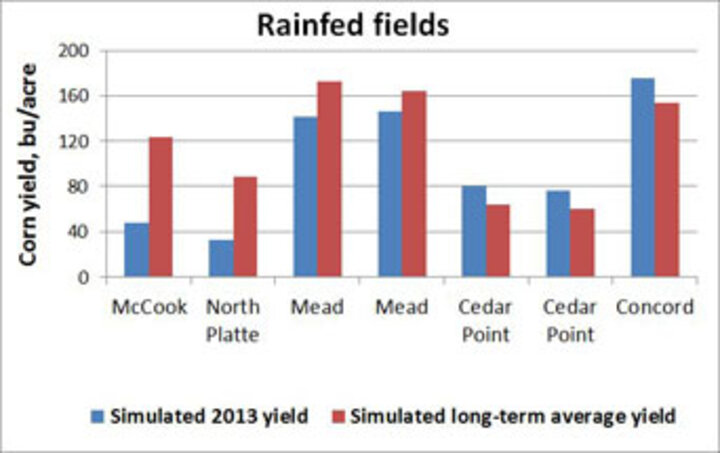
Figure 3. Model simulated 2013 and long-term average corn yields using the same crop management data for fields listed in Table 1.
How Do Growing Conditions In 2013 Compare To Long-Term Averages?
We compared the 2013 simulated yields with simulated long-term average yields (on average 24 years) using the same crop management as used in 2013 (Figure 3). For irrigated fields, 2013 simulated yields trended higher than simulated long-term averages at the western sites (Cedar Point and Brule), were close to average at the south central sites (York and Clay Center), and were slightly lower than average in the east (Mead and Concord). For irrigated fields, the temperature regime during the grain-filling period (i.e., from silking to maturity) is the most important factor because, as noted above, it determines the duration of grain filling.
At Smithfield, for example, the mean temperature from silking to maturity was 72oF in 2013 compared to 63oF for an average year at this site. This resulted in 10 fewer days for grain filling in 2013 than in an average year. The opposite was true in the east at Mead, where the mean temperature from silking to maturity was 72oF for 2013 compared to 75oF for an average year, leading to three more days for grain filling in 2013 than in an average year.
For rainfed fields, rainfall during the growing season is the key factor to explain yield variation. Above-average rainfall normally leads to high yield and vice versa. Compared with simulated long-term averages, 2013 rainfed yields were lower in some areas in the west and east (Figure 3) and higher in the northeast (Concord) and one area in the west (Cedar Point). As discussed above, localized water supply, for example from isolated thunderstorms, could lead to yield in one field being significantly higher than yield from nearby fields, which adds to uncertainty in whether simulated yield for one location is representative of the surrounding geographic area.
Summary
Based on the on-farm yield reports and management information collected from the nine areas across Nebraska and the corresponding model simulations, irrigated corn yields in 2013 were slightly below long-term simulated averages in the west, transitioning to close to, or slightly higher than, long-term averages through south central and to the east. This trend is due largely to the relatively higher temperature during the grain-filling period than long-term averages in the west, but close to or lower than long-term averages in the south central and southeast. As a result, the duration of corn grain filling was shorter in the west, and close to or longer in the south central and southeast areas than long-term averages.
For 2013 rainfed corn, western Nebraska had lower yield while northeast Nebraska had higher yield than the simulated long-term averages. As rainfed corn yield is closely associated with amount and timing of rainfall during the growing season, some areas in the west (Cedar Point) and east (Concord and one site at Mead) also saw better rainfed corn yields in 2013 than simulated long-term averages.
Haishun Yang, Extension Crop Simulation Modeler
Charles Shapiro, Extension Soils Specialist
Greg Kruger, Extension Crops Specialist
Keith Glewen, Extension Educator
Gary Zoubek, Extension Educator
Jenny Rees, Extension Educator
Patricio Grassini, Extension System Agronomist
Ken Cassman, Extension Agronomist
