2nd highest year for irrigated; near 7-year average for rainfed systems
In late March USDA-NASS released statistics on irrigated and rainfed corn and soybean yields in Nebraska counties for the 2013 crop season. According to the data, Nebraska statewide irrigated and rainfed yield averages were a respective 197 and 130 bu/ac for corn (Figures 1-2) and 61 and 48 bu/ac for soybean (Figures 3-4). The 2013 yields of irrigated corn and soybean were the second highest in history, only slightly below the record-yield years of 2009 for corn and 2011 for soybean. Rainfed yields for 2013 were higher than the average rainfed yields in the four years (2008-2011) preceding the disastrous 2012 drought.

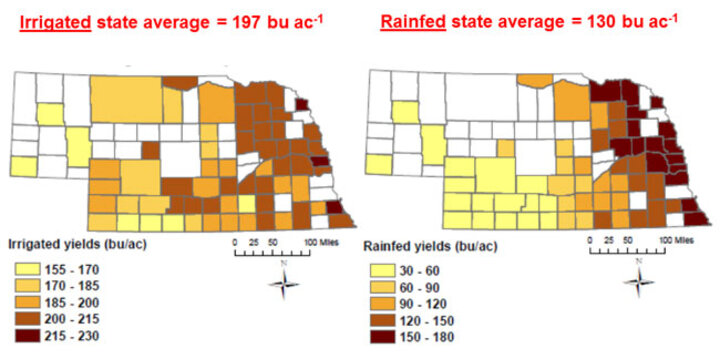
Figure 1. 2013 irrigated and rainfed average corn yields by county in Nebraska. (White counties indicate corn area was less than 4,000 acres or USDA-NASS data was not available.) (Source: USDA NASS data compiled and mapped by Patricio Grassini)

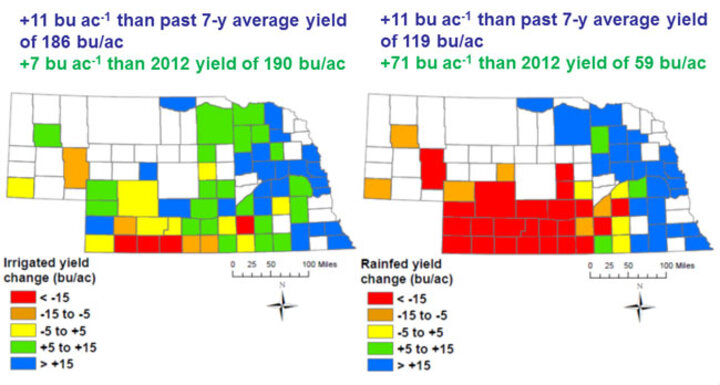
Figure 2. Difference between 2013 and past seven-year (2006-2012) average corn yields, reported by county. (White counties indicate corn area was less than 4,000 acres or USDA-NASS data was not available.) (Source: USDA NASS data compiled and mapped by Patricio Grassini)
Spatial Variation in Irrigated and Rainfed Corn and Soybean Yields
Comparing 2013 yields with an average of the last seven years (2006-2012) shows whether they were below, near, or above the historical average. The Nebraska statewide yield for irrigated corn in 2013 was 197 bu/ac, 7 bushels above the 2012 yield and 11 bushels above the average for the past seven years (2006-2012) (left maps in Figures 1-2). The highest county-level average irrigated corn yields (>200 bu/ac) were reported for northeast Nebraska and some scattered counties in south-central and southeast Nebraska. Irrigated yields in 2013 were well above (>15 bu/ac) the seven-year average yield in east-central Nebraska and slightly above (5 to 10 bu/ac) or near average in the rest of Nebraska.
For dryland corn, statewide average yield was 130 bu/ac, 71 bushels above the 2012 Nebraska average and 11 bushels above the 2006-2012 average (right maps in Figures 1-2). Rainfed corn yields decreased from east (150-180 bu/ac) to west (30-60 bu/ac) following the longitudinal gradient in rainfall. Compared with the past seven-year average yield, rainfed yields in 2013 were well above average (>15 bu/ac) in eastern Nebraska and well below average (


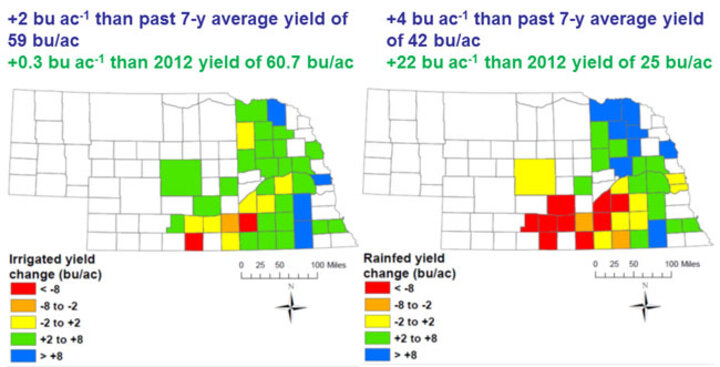
Figure 4. Difference between 2013 and past seven-year (2006-2012) average soybean yields, reported by county. (White counties indicate corn area was less than 4,000 acres or USDA-NASS data was not available.) (Source: USDA NASS data compiled and mapped by Patricio Grassini)
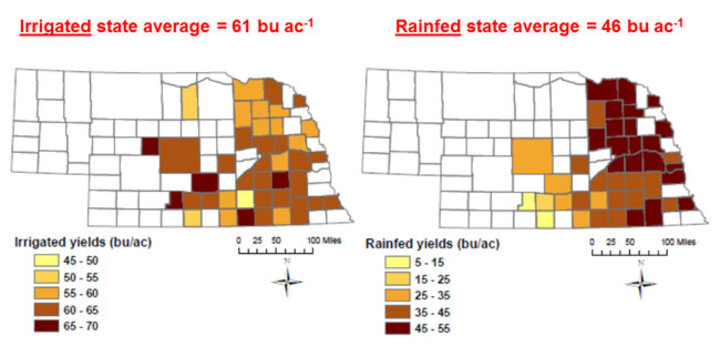
The Nebraska statewide irrigated soybean yield in 2012 of 61 bu/ac was only 0.3 bushel above 2012 Nebraska irrigated soybean average and 2 bushels above the seven-year average (left maps in Figures 3-4). The highest county-level average irrigated soybean yields, in the range of 60 to 70 bu/ac, were reported in south-central and southeast Nebraska. Irrigated yields in 2013 were slightly above (2 to 8 bu/ac) the past seven-year average in most counties, except in south-central Nebraska.
For dryland soybean, the average yield was 46 bu/ac, which was 22 bushels above the 2012 Nebraska average and 4 bushels above the past seven-year average (2006-2012) (right maps in Figures 3-4). Similar to rainfed corn, soybean rainfed yield decreased from east to west, with the highest county-level average dryland soybean yields, in the range of 45 to 55 bu/ac, reported in eastern Nebraska.
Compared with the past seven-year average yield, rainfed soybean yields in 2013 were well above average (>8 bu/ac) in northeast Nebraska, slightly above (2 to 8 bu/ac) in the rest of eastern Nebraska, and well below (
|
|
|||||||
| Table 1. Average Nebraska weather conditions during July-August 2013, reported by regions. (Average values for July-August 2006-2012 are in italic.) (Source: High Plains Regional Climate Center) | |||||||
|
|
|||||||
| Nebraska Region | Location |
Average Solar Radiation (Langley/day)* |
Average Maximum Temperature ( F)* |
Average Minimum Temperature ( F)* |
Total Rainfall (inches) |
Total Reference ET (inches) |
Soil Water May 1 (%)** |
|
|
|||||||
| Northeast | Concord |
474 (505) |
82.7 (84.0) |
61.5 (61.9) |
5.4 (7.8) |
13.7 (14.3) |
30 (30)
|
| East-Central | Mead |
477 (489) |
85.5 (86.4) |
62.2 (63.1) |
2.3 (7.3) |
13.7 (13.1) |
30 |
| Southeast | Clay Center |
496 (500) |
84.6 (86.1) |
62.7 (62.6) |
5.6 (6.5) |
14.1 (14.3) |
37 (34)
|
| South Central | Holdrege |
481 (531) |
88.2 (87.4) |
62.5 (61.7) |
2.7 (6.2) |
17.3 (16.4) |
32 (36) |
| Southwest | North Platte |
494 (522) |
87.5 |
61.6 (61.1) |
3.1 (4.3) |
16.4 (16.2) |
18 (25) |
|
|
|||||||
|
* Average daily solar radiation and maximum and minimum temperature during July-August ** Percentage soil water in the root zone (and historical average value in parenthesis) |
|||||||
|
|
|||||||
Explanatory Factors for Differences Between 2013 and Previous-Year Yields
Table 1 summarizes weather conditions at five Nebraska locations during July and August 2013, the period when flowering and grain-filling of corn and soybean would have occurred. It also includes July-August averages for the past seven years (2006-2012). In Nebraska higher irrigated corn yields are associated with cooler growing conditions during the crop reproductive stages (silking and grain filling). In 2013, average daily maximum and minimum temperatures during July and August were consistently 1-2ºF below the past seven-year average, except for Holdrege and North Platte. Hence, it is likely that cooler temperatures in eastern Nebraska extended grain fill, resulting in higher corn yields in 2013.
In the case of irrigated soybean, the more favorable 2013 crop season may have been partly offset by later plantings than in the previous seven-year period (one to two weeks later in most counties), resulting in a relatively small yield advantage over previous years. In general, southeast Nebraska did see good irrigated yields (and also rainfed yields) for both corn and soybeans in 2013 wherever significant storm damage did not hinder yields. However, the figures clearly show that Clay County had reduced corn and soybean yields and a larger yield departure from the past seven years compared to surrounding counties. This was most likely the result of an August 1, 2013 storm that impacted yields on an estimated 170,000 acres of corn and 86,000 acres of soybeans.
Rainfed yields in Nebraska are associated with the degree of water deficit during July and August which depends on the rainfall and evapotranspiration (ET). The relatively low rainfed crop yield in 2013 in western Nebraska, compared with the past seven-year yield average, can be associated with below-average rainfall and slightly above-average ET (Table 1) for North Platte and Holdrege. Also, soil water content around planting (May 1) was much lower at these two locations compared with the historical average and this may have amplified the impact of a water deficit later in the season.
Rainfall at Concord and Clay Center (eastern Nebraska) in July-August 2013 was slightly (about 1 inch) below the past seven-year average, while ET was also slightly below, resulting in higher rainfed crop yields than in western Nebraska (except in some counties where crops were damaged by hail). In addition, soil water at planting was near the historical average and this may have served to buffer transitory water deficits.
At Mead (east-central Nebraska), July-August rainfall was well below (about 5 inches) the past seven-year average and even lower than rain in western Nebraska. Although one would expect lower yields in this region, in fact, actual yields of both corn and soybean were significantly higher than the previous seven-year average. The high water content at planting might have partly offset the negative impact of lower in-season rainfall but more research is needed to understand the relatively good yield performance of this location despite such small amount of rainfall. Similar discrepancy at the same location was reported in a previous Crop Watch article.
Patricio Grassini, Extension Cropping System Agronomist
James Specht, Professor, Agronomy and Horticulture
Haishun Yang, Extension Crop Modeler
Charles Shapiro, Extension Soils Specialist
Greg Krueger, Extension Cropping Systems Specialist
Keith Glewen, Extension Educator
Jenny Rees, Extension Educator
April 9, 2014
