Key Takeaways
Topsoil plays a crucial role in nitrate retention, likely due to active uptake by corn roots.
Soil moisture directly influences nitrate mobility, with higher moisture increasing the risk of downward leaching.
Precise irrigation decisions are critical for minimizing nitrate losses beyond the root zone, especially under pivot systems.
The TAPS program bridges scientific research and on-farm applications, allowing producers to test nitrogen and irrigation strategies in a risk-free, research-supported environment.
Introduction
Nebraska has a significant number of wells with nitrate concentrations above the EPA drinking water standard of 10 mg NO3-/L(Nebraska Department of Environmental Quality, 2018). Groundwater nitrate contamination has been a persistent concern in the state, with historical data indicating that areas such as the Upper Elkhorn River have consistently reported levels above the federal limit since at least the 1970s (Engberg and Spalding, 1978). This is particularly alarming because more than 88% of the state’s population relies on groundwater for drinking water (Liu et al., 2022).
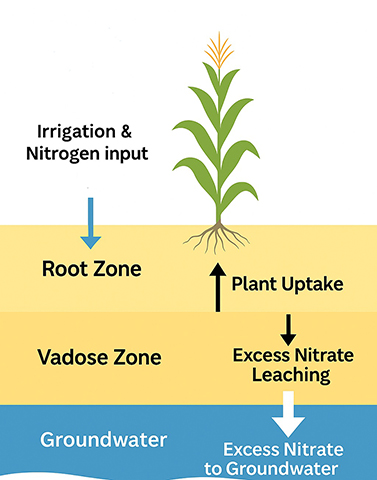
Nebraska’s flat landscape and well-drained soils play a critical role in the movement of nitrate from agricultural fields into groundwater. These geographic and geologic conditions, combined with intensive land use practices — especially nitrogen-heavy agriculture — create an environment where excess nitrogen fertilizers can readily move past the root zone (Cherry et al., 2019). When nitrogen application exceeds crop uptake and coincides with high rainfall or irrigation events, nitrate (NO₃⁻) readily leaches through the vadose zone and reaches the aquifer, increasing the risk of groundwater contamination (Figure 1).
Nitrate is transported more rapidly to groundwater under irrigated lands than non-irrigated land (Nebraska Department of Environmental Quality, 2018). Approximately 80% of Nebraska’s irrigated corn acres are located in in the central and eastern parts of the state (U.S. Department of Agriculture, 2009), so groundwater nitrate contamination is most prevalent there. Although western Nebraska has historically experienced lower contamination levels, nitrate concentrations are now beginning to rise.
Nitrate contamination in drinking water is a significant public health concern due to its link to serious conditions such as methemoglobinemia in infants, and potential long-term effects, including cancer and adverse birth outcomes (Ward et al., 2005). In response, Nebraska has implemented policy-driven initiatives to promote better nitrogen management.
In 2024, the state enacted the Nitrogen Reduction Incentive Act (NiRIA), offering financial incentives ($10–15 per acre) to growers who reduce commercial nitrogen use by either 40 lb/ac or 15% from typical application rates. In addition, the University of Nebraska–Lincoln’s research and extension team developed the Testing Ag Performance Solutions (TAPS) program to engage ag professionals and producers in evaluating how management decisions affect yield, profitability, input use efficiency and groundwater nitrate levels.
This article uses data from the 2024 TAPS Continuous Corn Competition to assess how on-farm management decisions influence nitrate transport into the vadose zone and groundwater. The objective is to identify strategies that reduce nitrate leaching without compromising crop productivity.
What is the TAPS Continuous Corn Competition?
The UNL Testing Ag Performance Solutions (TAPS) program provides a producer-driven, research-backed platform that bridges the gap between policy and on-farm implementation. At its North Platte site, TAPS allows participants to experiment with nitrogen and irrigation strategies in a low-risk, competitive environment. This hands-on framework enables producers to optimize inputs and minimize environmental impacts.
This approach is critical because nitrate accumulation often results not only from overapplication, but also from mismatches between nitrogen application timing and plant nutrient demand (Jia et al., 2014). Similarly, excess irrigation water not taken up by crops can transport nitrate deep into the vadose zone and ultimately reach groundwater.
By integrating research, education and technology, TAPS empowers producers to improve input use efficiency, environmental sustainability and profitability through real-world, hands-on learning. This article summarizes findings from the 2024 TAPS competition, highlighting initial results on how different nitrogen and irrigation management strategies influenced nitrate leaching into the vadose zone and underlying aquifer.
Irrigation and Nitrogen Decisions by Farmer Participants
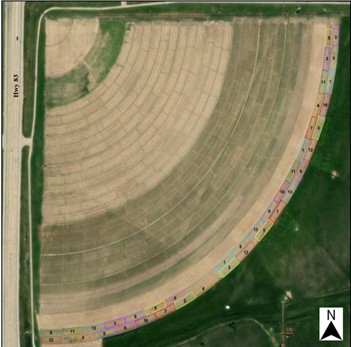
During the 2024 TAPS Continuous Corn Competition, 13 teams participated, each managing an experimental-sized plot randomly assigned and replicated within designated sections of the field, referred to as “farms.” Teams were given flexibility to determine their nitrogen fertilizer strategies, including application at planting and in-season through side-dress and fertigation, using UAN 32% as the nitrogen source.
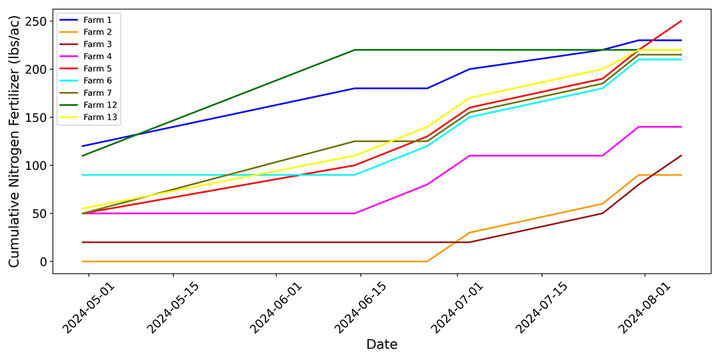
As shown in Figure 3, nitrogen application rates varied widely across farms:
- Farm 5 (250 lbs/acre) and Farm 1 (230 lbs/acre) applied the highest nitrogen rates.
- Farm 3 (110 lbs/acre) and Farm 2 (120 lbs/acre) applied the lowest rates.
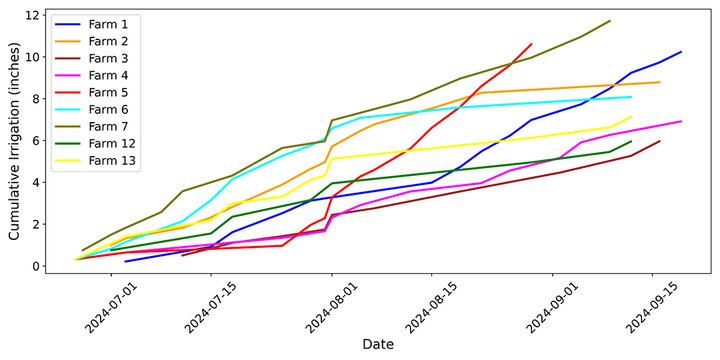
Irrigation was managed using a center pivot system scheduled to operate every Monday and Thursday from mid-June through mid-September. Based on the 2024 irrigation data (Figure 4):
- Farm 7 (11.71 inches) and Farm 5 (10.60 inches) received the highest irrigation amounts.
- Farm 12 (5.95 inches) and Farm 3 (5.96 inches) received the lowest amounts.
Monitoring Nitrates Losses in TAPS Continuous Corn Competition
TAPS employs a series of field instruments and data collection methods to monitor nitrogen loss from experimental plots. Suction lysimeters (purchased with support from an NDWEE grant) were installed beneath each TAPS plot to capture nitrate leachate and assess nutrient movement below the root zone.
Neutron access tubes were also installed, and neutron probes were used to estimate the water movement below the crop root zone, providing insight into irrigation efficiency and potential nitrate leaching. These measurements are critical for calculating the amount of nitrogen that leaches past the root zone in each plot.
In addition, plant tissue samples were collected at the tasseling stage and shared with participants to inform plant nitrogen status under their respective nutrient management strategies. Residual soil nitrogen was measured at the end of the growing season, providing a comprehensive evaluation of nitrogen use efficiency across TAPS-managed plots.
The summary of all data collected in the TAPS program is presented in the annual TAPS report.
Nitrate Leaching Trends: Soil Water Versus Nitrate Accumulation and Movement
Using data from the 2024 TAPS Continuous Corn Competition, the effects of varying irrigation and nitrogen inputs were evaluated in terms of soil nitrate accumulation, vertical distribution across the 0–60 inches soil profile and the potential for leaching beyond the root zone.
How Much Nitrates Accumulated in the Root Zone and Shallow Vadose Zone Across TAPS Participants?
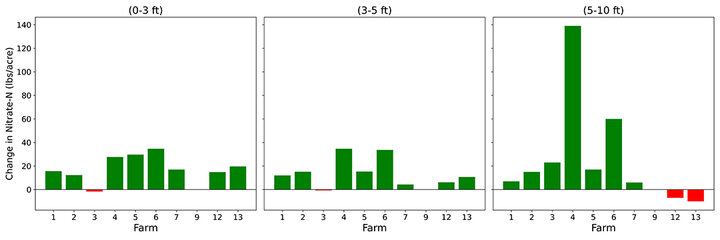
Figure 5 illustrates differences in soil nitrate concentration across three depth intervals — 0–3 ft (root zone), 3–5 ft (shallow vadose), and 5–10 ft (deep vadose), relative to Farm 9 which served as the control with no irrigation or nitrogen fertilizer. In most treated farms, nitrate levels were higher than those observed in the control across all depths, indicating that irrigation and nitrogen applications contributed to progressive nitrate accumulation through the soil profile (Figure 5).
Comparing Nitrate Distribution and Leaching Potential Across Soil Depth Under Different Irrigation and Nitrogen Applications
Figure 6 demonstrates how soil moisture levels influence nitrate retention and transport across a 0–60 inches soil profile under varying irrigation and nitrogen management strategies. Panel (i) represents low-input management (100 lbs N/acre; 5.96 inches irrigation), while panel (ii) represents high-input conditions (250 lbs N/acre; 10.60 inches irrigation), both compared with the non-irrigated, unfertilized control.
Farms with higher nitrogen and irrigation inputs exhibited significantly elevated residual nitrate concentrations and greater soil moisture. For instance, Farm 5, which received the highest nitrogen application, shows pronounced nitrate accumulation in the upper 0–20 inches soil layer, suggesting nitrogen inputs exceeded crop uptake capacity. Similarly, Farm 7 (panel iii), which received the highest irrigation, exhibited greater soil moisture than both the control and the lowest-irrigated site Farm 12 (panel iv), increasing the potential for nitrate movement beyond the root zone.
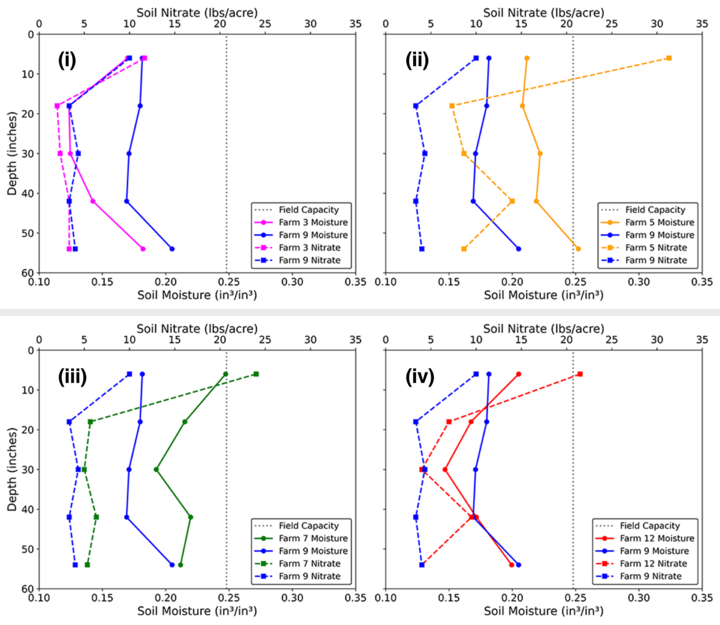
These vertical trends reflect the interaction of root uptake, fertilizer timing and soil hydraulic properties. Corn’s dense root system primarily extracts water and nitrate from shallow soil layers, which are rapidly replenished by rainfall or irrigation. Under wetter conditions or excessive irrigation, however, the soil’s limited capacity to retain nitrate at depth increases the likelihood of leaching toward groundwater.
When soil moisture approaches or exceeds field capacity (approximately 0.248 in³/in³ in this region), gravitational drainage is likely to occur, enhancing nitrate transport below the root zone. These findings underscore that excessive nitrogen and irrigation inputs elevate nitrate leaching risk. Managing soil water dynamics by minimizing drainage below the root zone and reducing nitrate buildup in surface layers can help mitigate groundwater contamination.
Conclusion
These results highlight the strong link between management practices and nitrate mobility, emphasizing the risk that excess nitrate not retained in the root zone may leach into deeper soil layers and ultimately contaminate groundwater. Findings from the 2024 TAPS Continuous Corn Competition clearly demonstrate the influence of nitrogen fertilizer and irrigation practices on soil nitrate accumulation.
High nitrogen application rates led to substantial nitrate buildup in the soil profile, increasing the potential for groundwater contamination. Due to limited lysimeter data, nitrate movement beyond the root zone could not be fully quantified in this study. However, the continuous corn competition continued during the 2025 growing season, and by the end of the year, a more comprehensive dataset combining results from 2023, 2024 and 2025 will be available. This expanded dataset will support more informed and effective nitrogen and irrigation management decisions.
Acknowledgment for Financial Support
The authors would like to thank the Nebraska Department of Water, Energy and Environment (NDWEE) for providing the funding (Grant Number, 56-233) through Small Project Assistance Grants to support the implementation of this study in TAPS Continuous Corn Competition. Funding was primarily used to purchase ceramic cup lysimeters for in-season water nitrate sampling and deep soil coring following corn harvest. All data collected through this project are presented in this article.
References
- Cherry, M., Gilmore, T., Mittelstet, A., Gastmans, D., & Gates, J. (2019). Isotopic Composition of Groundwater and Precipitation in Nebraska, USA.
- Engberg, R. A., and Spalding, R. F. (1978). Groundwater quality atlas of Nebraska. Conservation and Survey Division, Institute of Agriculture and Natural Resources, University of Nebraska-Lincoln; WorldCat.
- Jia, X., Shao, L., Liu, P., Zhao, B., Gu, L., Dong, S., Bing, S. H., Zhang, J., and Zhao, B. (2014). Effect of different nitrogen and irrigation treatments on yield and nitrate leaching of summer maize (Zea mays L.) under lysimeter conditions. Agricultural Water Management, 137, 92–103. https://doi.org/10.1016/j.agwat.2014.02.010
- Liu, M., Min, L., Wu, L., Pei, H., and Shen, Y. (2022). Evaluating nitrate transport and accumulation in the deep vadose zone of the intensive agricultural region, North China Plain. Science of The Total Environment, 825, 153894. https://doi.org/10.1016/j.scitotenv.2022.153894
- Nebraska Department of Environmental Quality. (2018). 2018 Nebraska groundwater quality monitoring report.
- U.S. Department of Agriculture. (2009). 2007 census of agriculture.
- Ward, M. H., deKok, T. M., Levallois, P., Brender, J., Gulis, G., Nolan, B. T., and VanDerslice, J. (2005). Workgroup Report: Drinking-Water Nitrate and Health—Recent Findings and Research Needs. Environmental Health Perspectives, 113(11), 1607–1614. https://doi.org/10.1289/ehp.8043
