As growers complete corn and soybean planting, it's a good time to install Atmometers or ETgages as well as Watermark Sensors. We hope you won't need to irrigate for several weeks, but now is the time to begin making plans.
Crop consultants and producers in the Nebraska Ag Water Management Network (NAWMN) have been using ETgages and soil water sensors to aid their irrigation planning and management for nearly 10 years. These two tools are economical and can help take the guesswork out of your irrigation management decisions.
ETgages

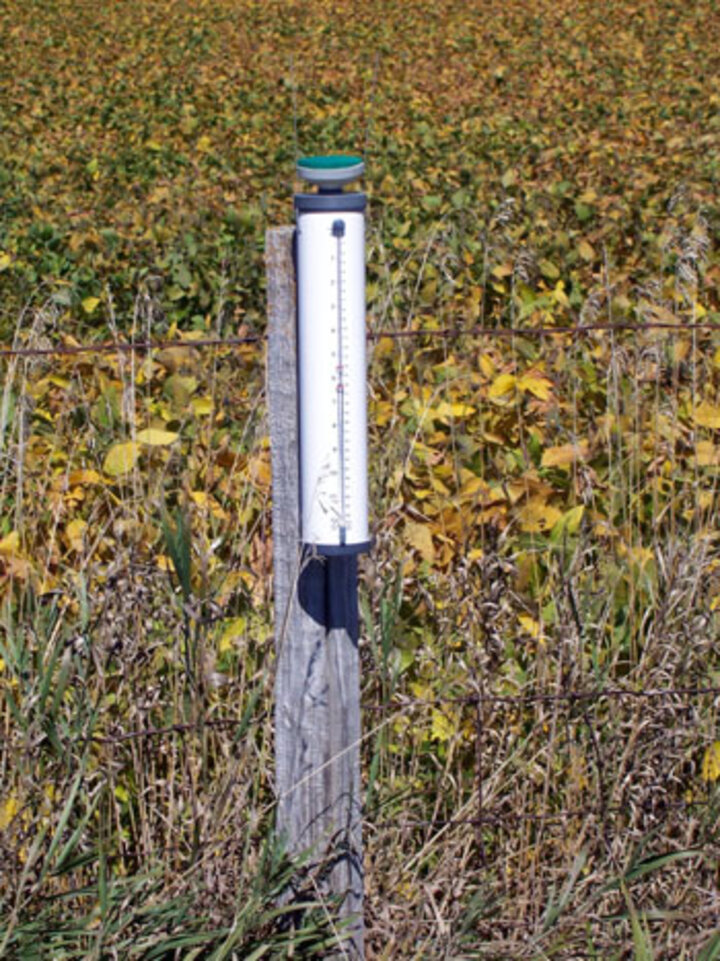
Figure 1. ETgage installed near soybean field

ETgages measure evapotranspiration — water loss from the soil through evaporation and from the plant through transpiration.
ETgages should be placed in open areas like fence lines, grass, alfalfa, soybean or small grains fields at least one foot above the canopy. ETgages take into account the humidity, temperature, solar radiation, and air movement of the area to provide an accurate estimate of potential crop evapotranspiration or ET.
Think of the ETgage (Figure 1) as being the opposite of a rain gauge. Instead of measuring rainfall, it measures how much the water level has dropped. This occurs as the water evaporates from a ceramic plate covered with green canvas to simulate a crop leaf. The ETgage is read at least once a week, preferably at the same time and day of the week each time.
Typically we use an ET gage with an alfalfa canvas (No. 54) to estimate the evapotranspiration for a fully irrigated alfalfa field, which is the basis for crop water use in Nebraska or the reference ET. To convert this reference ET to our actual crop ET, we use an adjustment factor called the crop coefficient (Kc) as shown in Table 1. If you know the ETgage drop for the week (reference ET) and your crop coefficient for your crop growth stage, you can multiply the two to calculate your crop's ET for the last week.
For example, let's calculate evapotranspiration water loss if your ETgage dropped 1.50 inches for the week and your corn was at V4. The crop coefficient for that stage is 0.18. Multiply 1.5 x 0.18 = 0.27 inch evapotranspiration for the week. If your neighbor planted corn earlier than you and that crop was at V8, the crop coefficient would be 0.51, so the crop ET would be 1.5 x 0.51 = 0.77 inch.
One of the advantages of using an ETgage is that it is located near your field and does a great job of estimating ET based on local conditions and your crop's growth stage. Once corn gets to the 16-leaf stage through beginning dent and soybeans are between beginning pod and full seed they both have a crop coefficient of 1.1, so you multiply the ETgage change for the week times 1.1 to estimate your crop ET.
For more information about using ETgages go to UNL's water.unl.edu/NAWMN ETgage link. There you can view information from producer's that are posting their ETgage readings as well as automatic weather station data. At the NAWMN website, check out the NebGuide "Using Modified Atmometers (ETgage®) for Irrigation Management" for more information as well as the crop coefficients for various crop growth stages.
The automatic weather stations, which show up as blue balloons on the map provide daily reference ETs as well as readings for the past three weeks.
Do you have an ETgage? If you do, we hope you'll consider posting your information to the website so that other producers can access the info.
|
|
|||||
| Table 1. Alfalfa-based crop coefficients (Kc) at the beginning of each growth stage for corn, soybean, and wheat. (Source: High Plains Regional Climate Center, 2005) | |||||
|
|
|||||
| Corn | Soybean | Wheat | |||
|
|
|
|
|||
| Growth Stage | Kc | Growth Stage | Kc | Growth Stage | Kc |
| 2 leaves | 0.10 | Cotyledon | 0.10 | Emergemce | 0.10 |
| 4 leaves | 0.18 | First Node | 0.20 | Visible Crown | 0.50 |
| 6 leaves | 0.35 | Second Node | 0.40 | Leaf Elongation | 0.90 |
| 8 leaves | 0.51 | Third Node | 0.60 | Jointing | 1.03 |
| 10 leaves | 0.69 | Beginning Bloom | 0.90 | Boot | 1.10 |
| 12 leaves | 0.88 | Full Bloom | 1.00 | Heading | 1.10 |
| 14 leaves | 1.01 | Beginning Pod | 1.10 | Flowering | 1.10 |
| 16 leaves | 1.10 | Full Pod | 1.10 | Grain Fill | 1.10 |
| Silking 1.10 | 1.10 | Beginning Seed | 1.10 | Stiff Dough | 1.10 |
| Blister 1.10 | 1.10 | Full Seed | 1.10 | Ripening | 0.50 |
| Dough 1.10 | 1.10 | Beginning Maturity | 0.90 | Mature | 0.10 |
| Beginning dent | 1.10 | Full Maturity | 0.20 | ||
| Full dent | 0.98 | Mature | 0.10 | ||
| Black layer | 0.60 | ||||
| Full maturity | 0.10 | ||||
|
|
|||||
Watermark Sensors

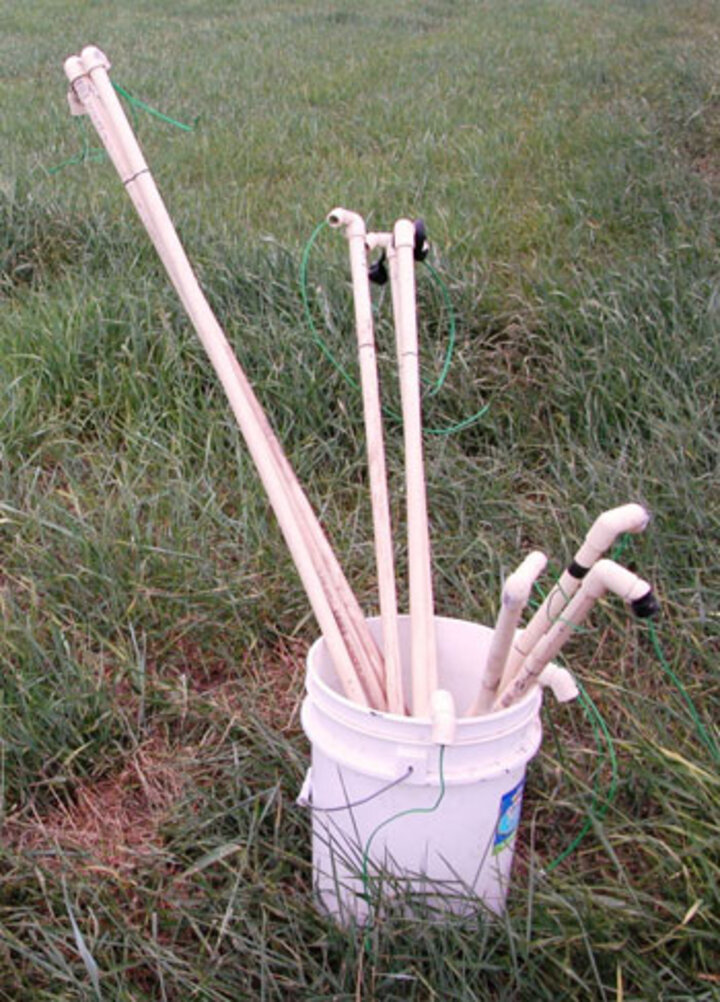
Figure 2. Watermark sensors ready to be installed

ETgages do a great job of estimating crop water use or ET, but it is important to also monitor soil water status. Watermark Sensors measure soil matric potential or the energy required to remove water from the soil. Once crops have emerged, Watermark sensors can be installed at 1-, 2-, 3-, and even 4-foot depths in the most representative areas of their fields. These sensors are glued onto PVC pipe and placed in the row between plants so they can be installed, used, removed at the end of the season, and reused the following year.
You need to do a little preparation work before heading to the field to install your Watermark sensors. The sensors need to be soaked in water and allowed to dry out, preferably two or three times prior to installing them in the field. When installing sensors, we suggest installing them wet. Also, be sure to check and make sure that no extra water has soaked up into the PVC tube by tipping the sensor and making sure no water sloshes around.
Timely installation of your Watermark sensors is important. Our goal is to get the sensors installed when conditions permit (neither too wet nor too dry) and before the crop gets too large. For more information on these sensors as well as installation tips, visit http://water.unl.edu/cropswater/nawmdn. This site also includes videos and publications on water management.
Information about using Watermark sensors is available is available in the newly released UNL Extension Circular, Principles and Operational Characteristics of Watermark Granular Matrix Sensor to Measure Soil Water Status and Its Practical Applications for Irrigation Management in Various Soil Textures.
New App Records Sensor Readings
Crop Water, a University of Nebraska-Lincoln mobile app, provides an easy way to estimate soil water status based on Watermark sensors installed at depths of 1, 2, and 3 feet. With these sensor readings, the Crop Water app will estimate the water used as well as what is still available for Nebraska soils. You can also see historic sensor readings. It was developed for the Nebraska Agricultural Water Management Network (NAWMN). It is available for both android and ios iphones/ipads at: https://itunes.apple.com/us/app/crop-water/id557926049?mt=8 or https://play.google.com/store/apps/details?id=edu.unl.cropwater
Gary Zoubek
Extension Educator
Aaron Nygren
Extension Educator
Chuck Burr
Extension Educator
