2015 Nebraska Cropland Rental Rates
July 9, 2015

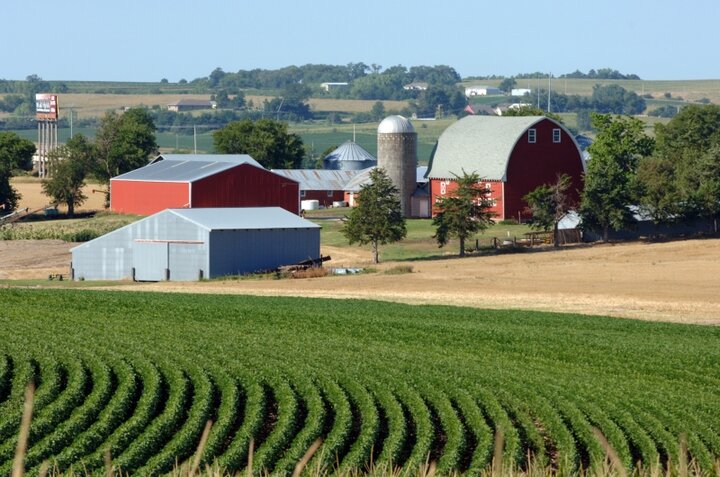
UNL's 2015 Farm Real Estate Survey indicates that dryland and irrigated cropland rental rates dropped 3%-10% from 2014. (Source: IANRNews photo)
The recently published Nebraska Farm Real Estate Market Highlights 2014-2015 report indicates dryland and irrigated cropland rental rates on average declined about 5% to 10% in Nebraska. Panel members indicated current crop prices as the driving force behind these lower cropland rental rates. The average rental rates for dryland and irrigated cropland are listed in Table 1. A list of counties in each Agricultural Statistics District of Nebraska can be found in the full report.
Rental rates for dryland and irrigated cropland vary across the state depending upon the district. Higher dryland cropland rental rates generally were focused in the eastern third of Nebraska compared to the western two-thirds of the state. Gravity and center-pivot irrigated cropland followed similar trends across the state. Local market forces along with inherent attributes of the ground are two of the major factors contributing to the rental rates paid by agricultural producers across Nebraska. With lower expected crop prices in 2015 landlords and tenants must remember to negotiate a rate that is viable for both parties involved.Survey results shown and discussed in this article are an excerpt from the University of Nebraska–Lincoln 2015 Nebraska Farm Real Estate Market Survey. Land values and rental rates presented in the annual publication are averages of survey panel members' responses by district. Actual land values and rental rates may vary depending upon the quality of the parcel and local market for an area. Complete results from the survey are available electronically via the Nebraska Farm Real Estate website: agecon.unl.edu/realestate.
Related Programs
Nebraska Extension will be hosting Landlord/Tenant Cash Lease workshops across the state, beginning Aug. 10. For more information and a schedule see cropwatch.unl.edu/2015-landlord-tenant-workshops.
Jim Jansen, (402) 254-6821
Extension Educator
Roger Wilson, (402) 472-1771
Budget Analyst and Farm Management Specialist
Co-authors of the Nebraska Farm Real Estate Market Developments survey
| Type of Land | Agricultural Statistics District | |||||||
| Northwest | North | Northeast | Central | East | Southwest | South | Southeast | |
|---|---|---|---|---|---|---|---|---|
| --- Dollars Per Acre --- | ||||||||
| Dryland Cropland | ||||||||
| Average | 35 | 65 | 235 | 105 | 205 | 45 | 85 | 170 |
| % Change | -13 | -7 | -4 | -5 | -5 | -10 | -6 | -3 |
| High | 50 | 85 | 305 | 140 | 255 | 60 | 115 | 215 |
| Low | 25 | 40 | 175 | 85 | 155 | 30 | 65 | 130 |
| Gravity Irrigated Cropland | ||||||||
| Average | 135 | 195 | 285 | 235 | 300 | 185 | 220 | 255 |
| % Change | -7 | -5 | -2 | -6 | -5 | -3 | -2 | -14 |
| High | 180 | 230 | 335 | 270 | 355 | 225 | 270 | 310 |
| Low | 75 | 155 | 225 | 195 | 260 | 145 | 175 | 225 |
| Center Pivot Irrigated Croplandb | ||||||||
| Average | 175 | 235 | 365 | 245 | 330 | 250 | 255 | 300 |
| % Change | -13 | -6 | -1 | -6 | -7 | -18 | -6 | -10 |
| High | 295 | 275 | 430 | 295 | 385 | 310 | 330 | 360 |
| Low | 150 | 190 | 285 | 215 | 270 | 225 | 240 | 265 |
|
Source: a Reporters' estimated cash rental rates (both averages and ranges) from the UNL Nebraska Farm Real Estate Market Survey, 2015. b Cash rents on center pivot land assume landowners own total irrigation system. |
||||||||
