A Yield Forecasting Center (YFC) has been established at UNL in collaboration with agronomists and extension educators from universities throughout the Corn Belt.
Meet the YFC Contributors
- Coordinating Team in UNL Department of Agronomy and Horticulture
- Yield Forecasting Center State Collaborators
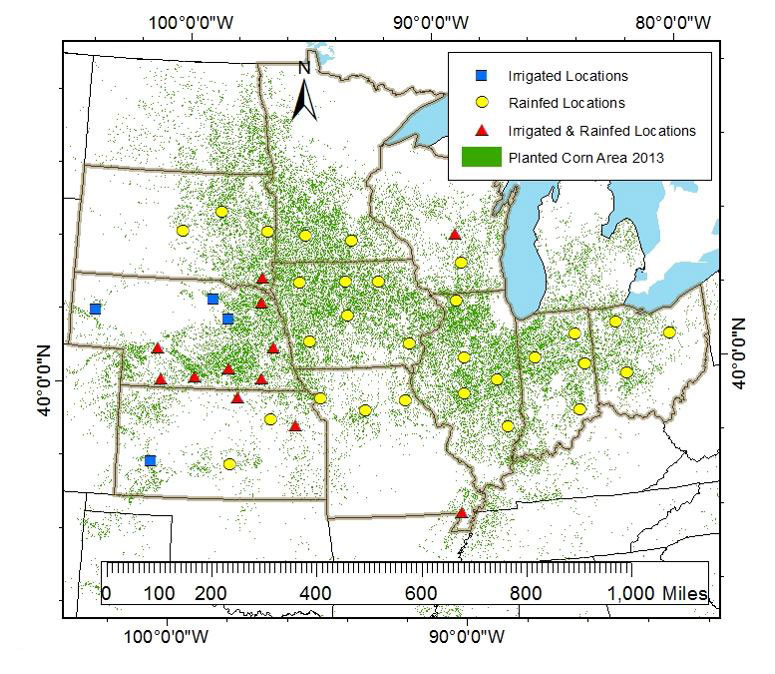
In 2014 corn yield forecasts were released at two-week intervals during the growing season. Forecast locations mainly focused on Nebraska and a few additional states across the Corn Belt. In 2015, the YFC has expanded the network of collaborators to include the 10 major corn-producing states (NE, IA, IL, SD, KS, IN, OH, MO, MN, WI) and will provide bi-weekly forecasts of corn yield for 45 locations to achieve more detailed spatial coverage of the Corn Belt during the 2015 crop season (Figure 1).
Separate forecasts will be provided for irrigated and dryland corn, depending upon prevalence of the two water regimes at each location. These forecasts will be released in CropWatch, starting in July and running until the end of the season. The present article summarizes the methodologies used in the YFC to forecast corn yield and provides guidelines for interpreting the results.
The YFC relies on
- a network of collaborators providing local management data and verifying forecasted yields
- measured high-quality, real-time weather data, and
- a well-validated crop simulation model (UNL Hybrid-Maize).
Local agronomists and extension educators provide information on management and soil data in each state and help validate and interpret the forecasts. Information provided by collaborators includes site-specific average sowing date (i.e., average calendar date at which 50% of the corn area was planted in the current season), plant population density, hybrid maturity, and dominant soil type. When both rainfed and irrigated production occurs at an observation location, separate sets of management practices are used for simulating rainfed and irrigated crops at those sites because the water regime has a large influence on production practices. Management data have been further validated using the information provided by DuPont Pioneer agronomists, especially with regard to hybrid maturity. While the YFC will forecast yields based on dominant management and soil at each location, we expect to also provide forecasts for different planting dates, hybrid maturities, and soil types in future years.
Historical (last 20+ years) and real-time daily weather data are needed for yield forecasting. Meteorological variables required for simulating real-time crop growth and development include solar radiation, maximum and minimum temperature, precipitation, relative humidity, wind speed, and precipitation. The YFC relies on measured data collected through state weather networks, including the
- High Plains Regional Climate Center (HPRCC),
- the Illinois Water and Atmospheric Resources Monitoring Program (WARM),
- Ohio Agricultural Research and Development Center (OARDC) Weather Service,
- the University of Wisconsin Extension Ag Weather,
- the Indiana Purdue Automated Agricultural Weather Station Network (PAAWS),
- the Southern Research and Outreach Center (SROC), and
- the Southwest Research and Outreach Center (SWROC) from the University of Minnesota,
- the South Dakota Climate and Weather, and the
- Missouri Mesonet (AgEBB).
Meteorological stations selected from these networks for use in yield forecasting are located in agricultural areas, rather than in urban areas, which helps to ensure their viability for forecasting corn yields.
Hybrid-Maize Corn Yield Simulator
| Table 1. Environmental factors accounted for and not accounted for by the Hybrid-Maize model to forecast corn yields. | |
| Accounted Factors | Non-Accounted Factors |
| Solar radiation | Nutrient supply |
| Temperature | Incidence of biotic stresses (weeds, insect pests, pathogens) |
| Relative humidity | Excess water |
| Wind speed | Hail |
| Reference evapotranspiration | Lack of stand uniformity |
| Precipitation | Soil crusting |
| Soil type | Severe heat/water stress around silking |
| Soil water at planting | Very early killing frost during gran filling |
| Plant population density | Green snap/lodging |
| Hybrid maturity | |
| Planting date | |
Hybrid-Maize is a crop simulation model developed by UNL researchers to simulate daily corn growth and development and final grain yield under irrigated and dryland conditions. The model estimates "yield potential," which is the yield obtained when the crop is not limited by nutrient supply, diseases, insect pressure, or weed competition — conditions that represent an "optimal management" scenario. It also assumes a uniform plant stand at the specified plant population and no problems from flooding or hail. Hence, forecasted yields are likely to overestimate yields in fields that suffer from any of these yield-limiting and reducing factors. Likewise, although the model can account for water stress and high temperatures during vegetative growth and the grain filling period, it likely will not portray well yield of crops under two, relatively uncommon situations:
- years when a crop suffers severe heat and water stress during the silking and pollen shed window of about seven days, and
- when an early frost kills the crop well before grain filling is completed.
But even with these relatively uncommon provisos, the model has been successfully evaluated across a wide range of environments where corn is produced with optimal management and yields have varied from 10 to 300 bu/ac (Figure 2).
How do we forecast real-time corn yields?
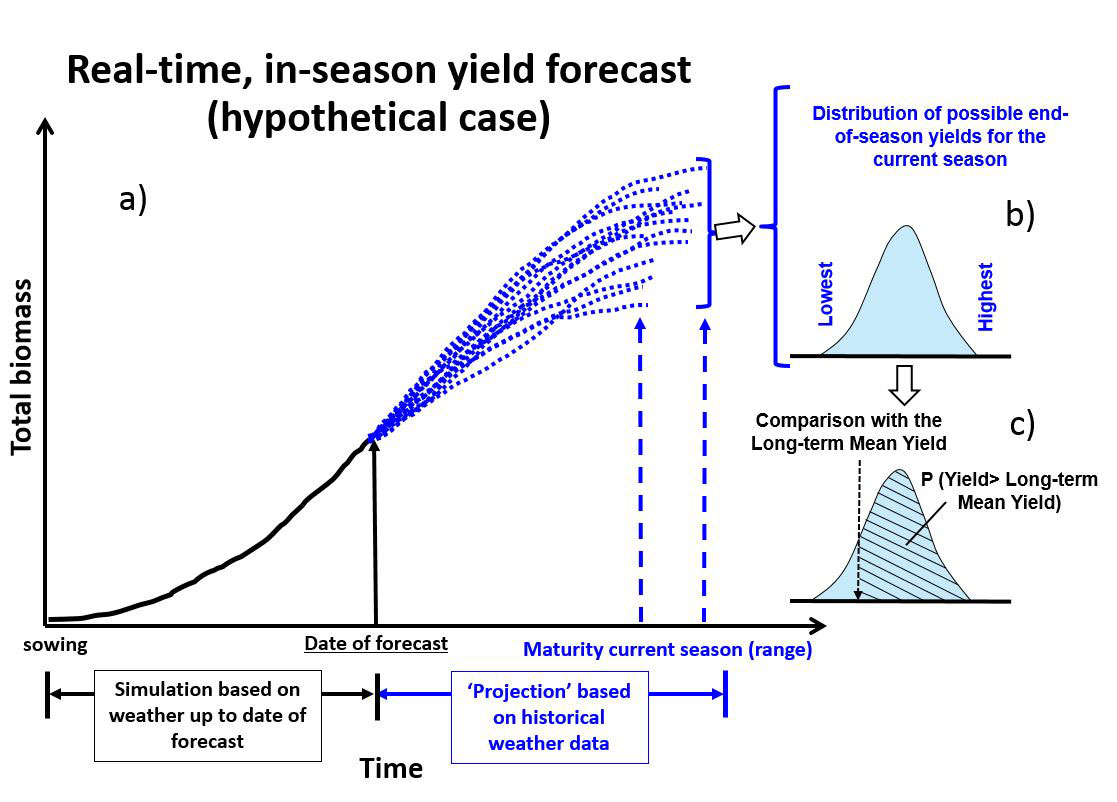
Hybrid-Maize uses measured weather data to simulate crop growth until the forecast date (solid black line in Figure 3a). Historical (20+ years) weather data are used to predict all possible weather scenarios for the rest of the season (blue dotted lines in Figure 3a). This results in a range of forecasted end-of-season yields (blue distribution inFigure 3b). By comparing the distribution of forecasted yields (blue-shaded area in Figure 3c) against the average yield simulated for the same location using the historical weather data (vertical arrow in Figure 3c), it is possible to determine the likelihood (probability) for current season yields that are below, near or above long-term average yield (dashed area in Figure 3c).
What to Expect During the Growing Season
Early in the season (May-June), yield forecasts for the current season mainly rely on historical weather and the range of forecasted yields will be wide and almost identical to the range of yields based on the historical weather data alone. As the season progresses (July-early August), and more of the current season's weather data are used in the simulations, the range of forecast yields may start to deviate from the long-term average yield, depending on the similarity of the current season's weather to the long-term average weather patterns. As the crop approaches maturity (end of August-September), the range of forecasted yields starts to shrink and the final yield can be forecast with greater confidence.
Yields obtained by most producers are expected to be lower than those yields reported in the YFC because the model simulations do not account for suboptimal management (for example, due to nutrient deficiencies, lack of stand uniformity) or yield losses from pests, hail, waterlogging, etc. On the other hand, yields reported by the YFC more closely track yields achieved in well-managed fields at a given location, where yields approach potential yields without yield losses. In contrast, in fields with a poor establishment or substantially affected by stress not accounted for in the Hybrid-Maize model, yield simulations are expected to be considerably higher than actual yields.
How To Use These Forecasts To Inform Farm Decisions
The information provided by the YFC allows adjusting yield goals for the current growing season in comparison to normal years. In some cases, this insight can support management decisions such as timing and amounts of fertilization and irrigation, or use of pesticides during the grain-filling period. Information from simulations during grain filling provide additional information to guide marketing decisions at all levels in the corn supply chain (producers, livestock sector, the ethanol industry, insurance companies, companies involved in commercialization and transportation, and policymakers).
During the 2015 UNL Crop Production Clinics, attendees (mostly crop growers and consultants) were asked about the yield forecasts released during the 2014 crop season. Half of the attendees followed the 2014 yield forecasts. Of the total attendees, one third recognized the value of the forecasts to inform marketing decisions; a third saw the forecast's value for improving management decisions; a third were interested in using the yield forecasts as benchmarks to diagnose yield gaps on their farms.
Yield forecasts will be released in CropWatch every two weeks during the 2015 crop season, starting by mid-July. We will also provide information on the range of forecasted yields, probabilities for above-, near-, or below-normal yields, and information on crop phenology and the probability of an early killing frost. Forecasts will be discussed in relation to the current season's weather versus the normal weather for each location to identify regions where yields are predicted to be well above or below long-term averages. An upscaled estimate of total Corn Belt production will be provided based on new methods developed for the Global Yield Gap Atlas.
