As you make your corn management plans this spring, don't overlook the importance of selecting the right planting rate. On-farm research is an excellent way to identify the correct population for your farming operation. In this article, results are presented for 40 on-farm trials. Net returns to planting rate were most commonly maximized at 34,000 and 28,000 seeds per acre for irrigated and rainfed corn, respectively, when corn was valued at $4 per bushel.
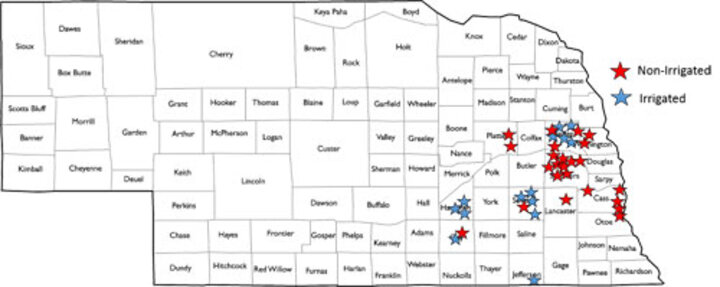
On-farm research is an excellent way to identify the correct population for your farming operation. From 2010 to 2014, growers involved in the Nebraska On-Farm Research Network conducted corn seeding rate studies in non-irrigated and irrigated fields, primarily in the eastern half of Nebraska. They mostly followed one of three planting rate protocols:

For more information on corn seeding rates see:
- Do You Need to Boost Your Corn Seeding Rate?
- Row Spacing and Seeding Rate Recommendations for Corn in (Central and Eastern) Nebraska (NebGuide 2216)
- Recommended Seeding Rates and Hybrid Seleciton for Rainfed (Dryland) Corn in Nebraska (NebGuide 2068)
For irrigated fields
- 28K, 32K, 36K, 40K seeds/acre
- 30K, 34K, 38K, 42K seeds/acre
For non-irrigated fields
- 18K, 22K, 26K, and 30K seeds/acre
Corn Population Results and Recommendations
Nebraska On-Farm Research Network findings showed trial to trial variation in yield response to increasing populations. This variation is likely due to a combination of factors, including soil, climate, management, and hybrids.
An interactive tool to view individual yield results by location or year was developed by Nebraska Extension Educator Laura Thompson. You can view the non-irrigated corn population results or the irrigated results. Simply use the buttons on the slide within the tool to navigate.
Irrigated Sites
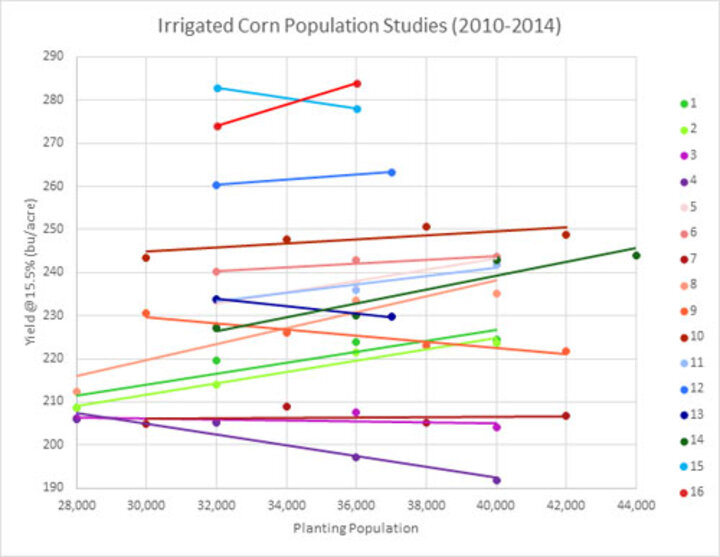
The maximum economic return for the irrigated sites ranged from 28,000 to 40,000 seeds/acre. With $4/bu corn prices, the 32,000 to 36,000 seeds/acre most frequently optimized economic return.
| Table 1. Location and seeding rates tested for 16 irrigated sites (Figure 1). | ||||||||
| Site | Year | County | Seeding Rates (in thousands seeds/acre) |
Hybrid ‡ | Most profitable population ($7/bu corn)† |
Yield (bu/ac) at most profitable population ($7/bu corn) |
Most profitable population ($4/bu corn)† |
Yield (bu/ac) at most profitable population ($4/bu corn) |
| 1 | 2010 | Seward | 28, 32,36,40 | C211-835 | 36000 | 224 | 36,000 | 224 |
| 2 | 2010 | Clay | 28, 32,36,40 | unknown | 40,000 | 224 | 36,000 | 221 |
| 3 | 2011 | Hamilton | 28, 32,36,40 | P 1625 | 28,000 | 206 | 28,000 | 206 |
| 4 | 2011 | Seward | 28, 32,36,40 | C 209-77VT3 | 28,000 | 206 | 28,000 | 206 |
| 5 | 2012 | Dodge | 32, 36, 40 | P 1625 | 40,000 | 243 | 40,000 | 243 |
| 6 | 2012 | Dodge | 32, 36, 40 | P 1395AM | 36,000 | 243 | 32,000 | 240 |
| 7* | 2012 | Seward | 30, 34, 38, 42 | BC 15-80 | 34,000 | 209 | 34,000 | 209 |
| 8 | 2012 | Seward | 28, 32,36,40 | C 211-82R | 36,000 | 234 | 36,000 | 234 |
| 9* | 2012 | Hamilton | 30, 34, 38, 42 | P 33D47 | 30,000 | 231 | 30,000 | 231 |
| 10 | 2012 | Hamilton | 30, 34, 38, 42 | DKC 63-87 | 38,000 | 251 | 34,000 | 248 |
| 11 | 2013 | Dodge | 32, 36, 40 | C 215-52 | 40,000 | 242 | 40,000 | 242 |
| 12 | 2013 | Dodge | 32, 37 | H 8066 AMX | 37,000 | 263 | 32,000 | 260 |
| 13 | 2013 | Dodge | 32, 37 | H 8345 AM | 32,000 | 234 | 32,000 | 234 |
| 14 | 1014 | Jefferson | 32, 36, 40, 44 | C 215-52 | 40,000 | 243 | 40,000 | 243 |
| 15 | 2014 | Dodge | 32, 36 | H 8389 | 32,000 | 283 | 32,000 | 283 |
| 16 | 2014 | Dodge | 32, 36 | H 8331 | 36,000 | 284 | 36,000 | 284 |
| Median | 36,000 | 34,000 | ||||||
| * These sites had limited irrigation. ‡ Seed abbreviations = DKC = DEKALB®, C = Channel®, P = Pioneer®, H = Hoegemeyer™, GH = Golden Harvest®, BC = Big Cob Hybrids † Profitability was calculated using seed corn costs of $250/unit (80,000 kernels/unit). |
||||||||

When combined across all sites, for each additional 1,000 seeds, 0.7 bu/acre of yield is added (Figure 2).
Non-Irrigated Sites
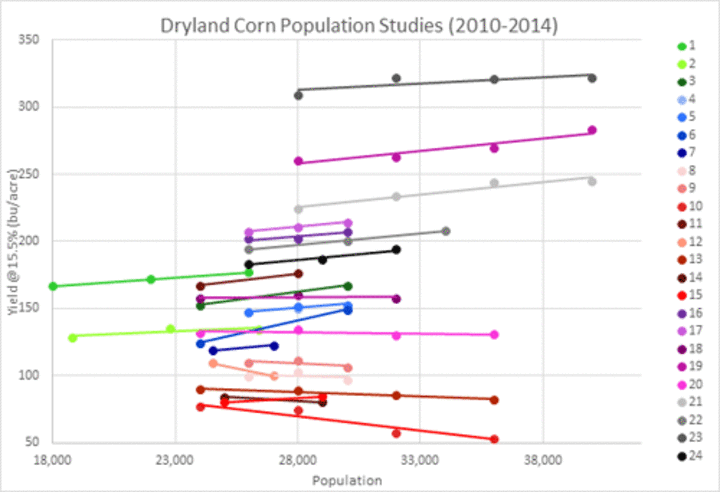
From 2010 to 2014, 24 non-irrigated sites were studied for corn population (Figure 2). Of these, six sites saw significant yield increases for planting populations above 28,000 seeds/acre. Our non-irrigated studies in eastern Nebraska showed we could plant 24,000 to 30,000 seeds/acre. However, yield response to seeding rate varied based on rainfall; in years with favorable growing conditions, some sites saw maximum economic returns as high as 40,000 seeds/acre.
| Table 2. County location, planting date, harvesting date, and hybrid for 24 non-irrigated corn population research sites. | ||||||||||
| Site | Year | County | Seeding Rates (in thousands seeds/acre) |
Planting | Harvesting | Hybrid ‡ |
Most profitable population |
Yield (bu/ac) at most profitable population ($7/bu corn) |
Most profitable population ($4/bu corn) † |
Yield (bu/ac) at most profitable population ($4/bu corn) |
| 1 | 2010 | Seward | 18, 22, 26 | unknown | unknown | C 211-835 | 26,000 | 177 | 26,000 | 177 |
| 2 | 2010 | Clay | 18.8, 22.775, 26.4 | unknown | unknown | P 35F40 | 22,775 | 136 | 22,775 | 136 |
| 3 | 2010 | Cass* | 24, 30 | 4/6/10 | 9/15/10 | DKC 65-63 | 28,000 | 150 | 28,000 | 150 |
| 4 | 2011 | Saunders | 26, 28,30 | 5/5/11 | 10/22/11 | C 210-57STX | 30,000 | 153 | 28,000 | 152 |
| 5 | 2011 | Saunders | 26, 28,30 | 5/5/11 | 10/22/11 | C212-455STX | 30,000 | 149 | 30,000 | 149 |
| 6 | 2011 | Cass† | 24, 30 | 5/7/11 | 10/22/11 | DKC 65-63 | 27,000 | 123 | 27,000 | 123 |
| 7 | 2011 | Dodge | 24.5, 27 | 4/28/11 | 10/14/11 | GH 9416 | 28,000 | 103 | 28,000 | 103 |
| 8 | 2012 | Saunders | 26, 28, 30 | 5/11/12 | 10/8/12 | C 212-45STX | 28,000 | 111 | 28,000 | 111 |
| 9 | 2012 | Saunders | 26, 28, 30 | 5/11/12 | 10/8/12 | C208-71VT2 | 36,000 | 182 | 28,000 | 176 |
| 10 | 2012 | Saunders | 24, 28, 32, 36 | 4/27/12 | 9/14/12 | H 8691 | 24,500 | 109 | 24,500 | 109 |
| 11 | 2012 | Cass† | 24, 28, 32, 36 | 4/21/12 | 9/7/12 | DKC 67-57 | 24,000 | 77 | 24,000 | 77 |
| 12 | 2012 | Dodge | 24.5, 27 | 4/22/12 | 9/4/12 | DKC 63-83 | 28,000 | 91 | 28,000 | 91 |
| 13 | 2012 | Washington | 24, 28, 32, 36 | 4/25/12 | 9/11/12 | DKC 59-88 | 24,000 | 90 | 24,000 | 90 |
| 14 | 2012 | Platte | 25, 29 | 5/5/12 | 9/18/12 | H 7711 | 25,000 | 84 | 25,000 | 84 |
| 15 | 2012 | Platte | 25, 29 | 5/5/12 | 9/18/12 | H 7876 | 29,000 | 84 | 29,000 | 84 |
| 16 | 2013 | Saunders | 26, 28, 30 | 5/15/13 | 11/2/13 | C 212-86STX | 30,000 | 208 | 30,000 | 208 |
| 17 | 2013 | Saunders | 26, 28, 30 | 11/2/13 | 11/2/13 | C 213-40VT3 | 30,000 | 214 | 30,000 | 214 |
| 18 | 2013 | Saunders | 24, 28, 32 | 5/16/13 | unknown | H 8691 | 40,000 | 284 | 40,000 | 284 |
| 19 | 2013 | Otoe | 28, 32, 36, 40 | 4/6/13 | 9/23/13 | DKC 64-69 | 28,000 | 134 | 24,000 | 132 |
| 20 | 2013 | Dodge | 24, 28, 32, 36 | 4/28/13 | unknown | P 1498 | 28,000 | 160 | 24,000 | 157 |
| 21 | 2014 | Lancaster | 28, 32, 36, 40 | 4/22/14 | 11/8/14 | DKC 64-87 RIB |
36,000 | 244 | 36,000 | 244 |
| 22 | 2014 | Washington | 26, 30, 34 | 5/5/14 | 11/3/14 | DKC 62-98 | 34,000 | 208 | 34,000 | 208 |
| 23 | 2014 | Cass | 28, 32, 36, 40 | 4/1/14 | 10/27/14 | DKC 67-57 RIB |
32,000 | 322 | 32,000 | 322 |
| 24 | 2014 | Saunders | 26, 29, 32 | 5/4/14 | 11/8/14 | C213-40 VT3PRIB C 215-81 VT2PRIB |
32,000 | 194 | 32,000 | 194 |
| Median | 28,000 | 28,000 | ||||||||
| * While not technically irrigated, these sites are located in river-bottom ground with a high water table and may be considered to be naturally sub-irrigated. ‡ Seed abbreviations = DKC = DEKALB®, C = Channel®, P = Pioneer®, H = Hoegemeyer™, GH = Golden Harvest® † Profitability was calculated using seed corn costs of $250/unit (80,000 kernels/unit). |
||||||||||

In limited irrigation situations, UNL research has shown yield losses by backing off populations too far in a dry year. (See CropWatch stories, Corn Populations and Deficit Irrigation and Is a Population Change Warranted in Irrigated Corn Due to Water Constraints?)
Hybrid genetics as well as soil, climate, and management can affect optimal seed rate for a particular situation. We recommend visiting with your dealer as seed companies have determined population calibration curves for each hybrid that may guide your decisions. Additionally, since the economic optimum planting population may vary from year to year and spatially, we suggest you test recommendations in your own fields. (See Test It for Yourself.)
To see more research results from the Nebraska On-Farm Research Network, visit https://cropwatch.unl.edu/resultshome.
Laura Thompson, Extension EducatorJenny Rees, Extension Educator
Charles Wortmann, Extension Soils Specialist
Keith Glewen, Extension Educator
Gary Zoubek, Extension Educator
On behalf of the Nebraska On-Farm Research Team
