|

|
|
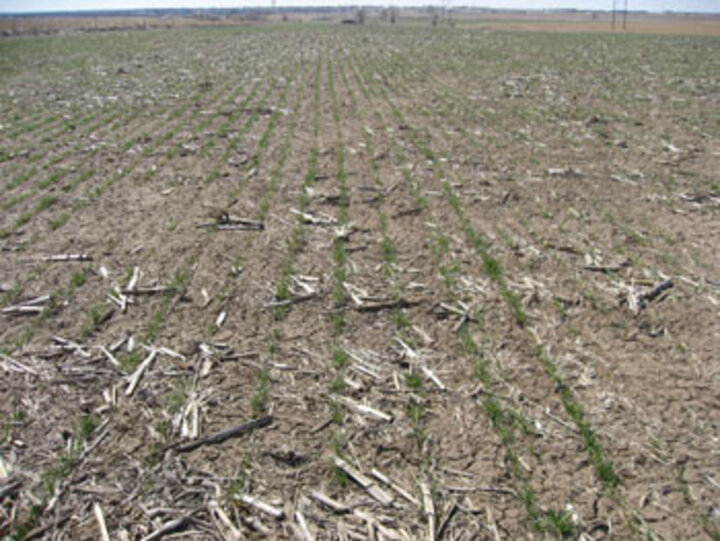
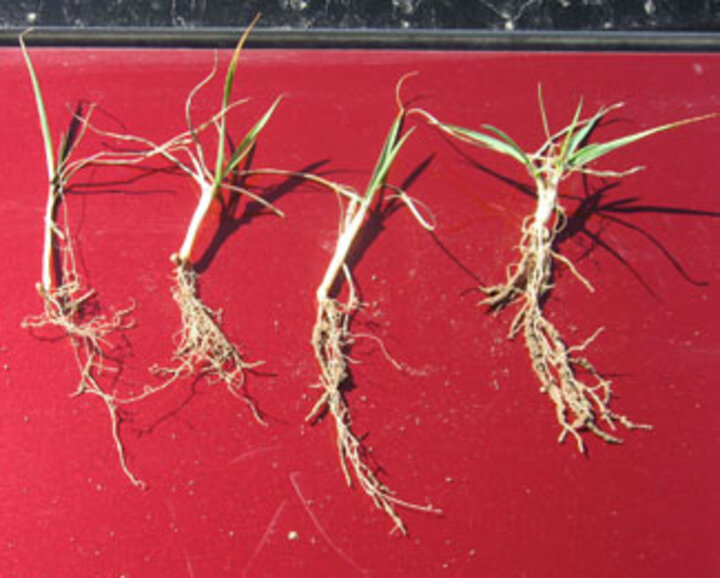
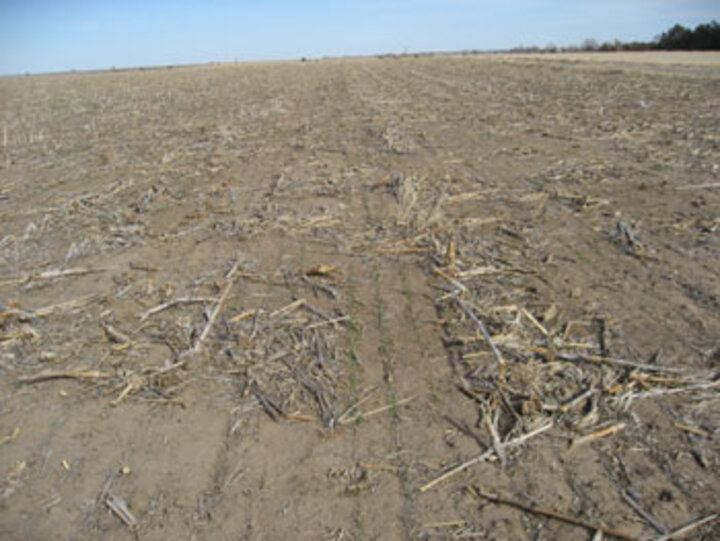
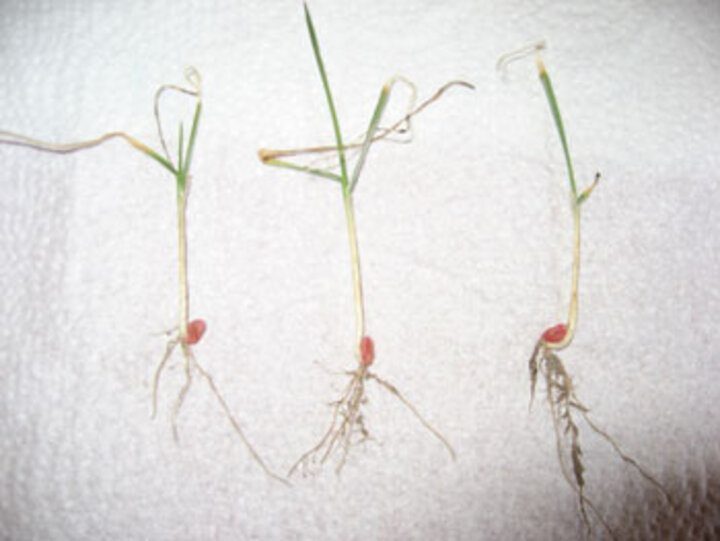
| Figure 1. Winter wheat in Red Willow County, taken March 20, 2013 | Figure 2. Plants from field in Red Willow County, taken March 20, 2013. (Photos by Bob Klein) |
March 22, 2013
|
With the lack of precipitation in late summer and fall in many areas of the state, winter wheat stands in some fields are questionable. This may be especially evident in continuous cropping situations. Dry conditions last fall and winter may have contributed to crown and root disease since dry soil warms up and cools down six times faster than moist soil. This alternating freezing and thawing will diminish the health of the wheat plant, damaging stands and decreasing yields.
This article will discuss two methods used to estimate wheat yields in the spring.
Understanding Seasonal Water Use
Winter wheat seasonal water use varies widely due to weather conditions, but generally it needs 16 to 24 inches. Using a midpoint of 20 inches, water use would be
- 4 inches from emergence to start of spring growth,
- 4 inches from start of spring growth to jointing,
- 2 inches from jointing to boot,
- 2.4 inches from boot to flower,
- 3 inches from flower to milk,
- 1.6 inches from milk to dough, and
- 3 inches from dough to maturity.
Normally it takes about 4-7 inches of water to get yield. For each inch of water above that, yield increases an average of 4-6.5 bushels per acre.
Estimating Wheat Yields Early
Wheat growers frequently need to estimate wheat yields in the spring to decide whether recropping is necessary. Determining a reasonable estimate of wheat yield allows growers to predict if it is in their best interest to destroy the wheat and plant a summer crop or leave the wheat for harvest. With little soil moisture in many areas of the state, the chance of a spring crop being successful is limited. In many situations, one will be better off leaving the winter wheat even though yield potential is low. The winter wheat crop usually has the field in better position for many crops that follow winter wheat. Before making such a decision, growers should be aware of any restrictions imposed by government programs, crop insurance, or previous herbicide use.
Several methods can be used to estimate winter wheat yield potential. This article will discuss two, both of which rely on several assumptions that may not be accurate for every season or situation. These assumptions presume that plants are healthy, soil moisture and nutrients are adequate, and that weeds, insects, and disease are not affecting yield. Added to the uncertainty of yield estimates is wheat’s ability to compensate for changes in the environment.
Table 1 is easy to use; however, it relies on several assumptions required to make a yield estimate in the fall or early spring prior to extensive tillering or stem elongation. These assumptions include:
- that the wheat plants, on average, develop about five heads;
- that each head, on average, develops about 22 kernels; and
- that there is an average of 16,000 kernels per pound.
|
Table 1. Estimated wheat yield potential if other factors do not limit yields. (See Table 2 and comments for yield adjustments for seeding date and emergence.) |
||||||||||||
|
|
||||||||||||
|
Row spacing |
Number of plants/foot row | |||||||||||
| 1 | 2 | 3 | 4 | 5 | 6 | 7 | 8 | 9 | 10 | 11 | 12 | |
| (inches) | ----- bushels/acre ----- | |||||||||||
|
|
||||||||||||
| 6.0 | 10 | 20 | 30 | 40 | 50 | 60 | — | — | — | — | — | — |
| 7.5 | 8 | 16 | 24 | 32 | 40 | 48 | 56 | 64 | — | — | — | — |
| 9.0 | 7 | 13 | 20 | 27 | 33 | 40 | 47 | 54 | 60 | — | — | — |
| 10.0 | 6 | 12 | 18 | 24 | 30 | 36 | 42 | 48 | 54 | 60 | — | — |
| 12.0 | 5 | 10 | 15 | 20 | 25 | 30 | 35 | 40 | 45 | 50 | 55 | 60 |
| 14.0 | 4 | 9 | 13 | 17 | 21 | 26 | 30 | 34 | 39 | 43 | 47 | 52 |
|
|
||||||||||||
To use Table 1, count the number of plants per foot of row. It is best to use at least five feet of row in at least five sites within the field and calculate the average number of plants per foot of row. If the stands are uneven, for example the stand is better or worse in the wheel tracks, make sure your percentage of samples in these areas accurately represents the proportion of these areas in the whole field. Locate the column in the table that corresponds to your average number of plants per foot of row and then move down that column until it intersects with the row corresponding to your row spacing. This is your estimated yield.
| Table 2. Mean date and number of plants that emerged; maximum, surviving, and productive fall tillers; maximum and productive spring tillers; and total productive spikes by Jagger and 2137 wheat varieties planted on four dates (Kansas State University at Hutchinson, Kansas, 1995). | |||||||||
|
|
|||||||||
|
Planting Date |
Emergence | Plants (no/yd) |
Fall tillers (no/yd2) max |
Fall tillers (no/yd2) surviving |
Total productive spikes |
Spring tillers (no/yd2) max |
Spring tillers productive |
Total productive spikes (no/yd) |
Yield bu/ac |
|
|
|||||||||
| Sept. 28 | Oct. 12 | 141 | 1266 | 578 | 281 | 584 | 195 | 476 | 39.0 |
| Oct. 11 | Oct. 18 | 207 | 916 | 594 | 360 | 659 | 192 | 552 | 57.7 |
| Oct. 28 | Nov. 15 | 141 | 183 | 183 | 152 | 600 | 272 | 424 | 54.8 |
| Nov. 13 | Nov. 30 | 143 | 147 | 147 | 117 | 213 | 144 | 260 | 30.2 |
| LSD (0.05) | 38 | 191 | 191 | 92 | 147 | 53 | 106 | 4.9 | |
|
|
|||||||||
Late-planted wheat and wheat seeds that do not germinate until later because of dry conditions will tiller less and have fewer heads. Table 2 has the results of winter wheat planted September 28 to November 13 with October 11 the best planting date at Hutchinson, Kansas. Winter wheat planted a month later yielded 48% less. The general conclusion is to expect winter wheat that emerges after January 1 to have a yield reduction of at least 50% compared to the normal yield.
Method 2
Table 3 was developed using data collected from 1994 to 1998 with the Nebraska Wheat Quality Tour. These tours were conducted near May 1, prior to head emergence in most of the state. Factors such as heavy weed, disease, or insect infestations or inadequate soil moisture at the time of the tour may suggest fewer final heads and a lower yield potential than indicated in the table. In addition, the table becomes unreliable in situations of extremely low or extremely high tiller counts, or in years when crop development as of May 1 is well ahead of or behind normal. For later season yield estimates, yield predictions can be made by substituting the actual number of heads per foot for tillers per foot.
| Table 3. Estimating winter wheat yield potential if other factors do not limit yields after stem elongation for the Nebraska Panhandle.* | ||||||||||||
|
|
||||||||||||
|
Row spacing |
Number of tillers/foot of row | |||||||||||
| 10 | 15 | 20 | 25 | 30 | 35 | 40 | 45 | 50 | 55 | 60 | 65 | |
| (inches) | ----- bushels/acre ----- | |||||||||||
|
|
||||||||||||
| 6.0 | 22 | 34 | 49 | 56 | 67 | 79 | 90 | 101 | 112 | — | — | — |
| 7.5 | 18 | 27 | 36 | 45 | 54 | 63 | 72 | 81 | 90 | 99 | 118 | — |
| 9.0 | 15 | 22 | 30 | 37 | 45 | 52 | 60 | 67 | 75 | 82 | 90 | 97 |
| 10.0 | 13 | 20 | 27 | 34 | 40 | 47 | 54 | 61 | 67 | 74 | 81 | 88 |
| 12.0 | 11 | 17 | 22 | 28 | 34 | 39 | 45 | 51 | 56 | 62 | 67 | 73 |
| 14.0 | 10 | 14 | 19 | 24 | 29 | 34 | 38 | 43 | 48 | 53 | 58 | 63 |
|
|
||||||||||||
| *This table was developed using data collected in the Nebraska Panhandle. For other Nebraska locations, multiply the yield in the table by the following factor: southwest Nebraska - 0.9; central and south central Nebraska - 0.85; southeast Nebraska - 0.75. | ||||||||||||
|
|
||||||||||||
To use Table 3, count the number of tillers per foot of row. Again, it is best to use at least five feet of row in at least five sites within the field and calculate the average number of plants per foot of row. Be sure sample sites are representative of the field. Locate the column in the table that corresponds to your average number of tillers per foot of row and then move down that column until it intersects with the row corresponding to your row spacing. This is the estimated yield. Although these multipliers may appear to be in error—everyone knows that wheat fields in the semi-arid Panhandle usually yield less than fields to the east—on a per head basis the multiplier is correct. Wheat fields in the sub-humid portions of the state produce more heads per acre, but typically fewer kernels per head than in the Panhandle.
For example, if your winter wheat field is in southwest Nebraska and you have an average of 30 tillers per foot of row, and your row spacing is 10 inches, multiply the table results of 40 bushels per acre by 0.9 to get a yield estimate of 36 bushels per acre.
Resource
For more information, see Estimating Winter Wheat Grain Yields (NebGuide 1429).
Bob Klein
Extension Western Nebraska Crops Specialist, West Central REC
Dipak Santra
Alternative Crops Specialist, Panhandle REC
Karen DeBoer
Extension Educator, Kimball, Banner, and Cheyenne Counties


