The Weekly Irrigation Newsletter on CropWatch features results from a collaborative Nebraska Extension research study involving three Nebraska growers, who are utilizing soil moisture sensors to schedule irrigation throughout the growing season. Results are updated every Tuesday.
Introduction
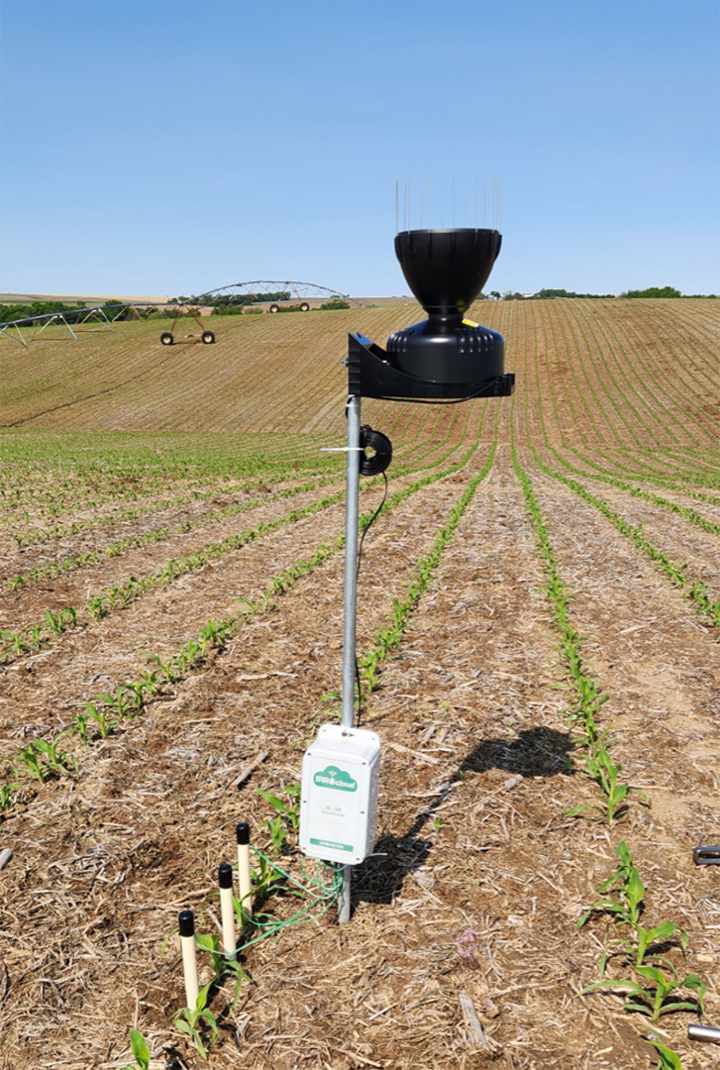
In 2024, Nebraska Extension launched the Weekly Irrigation Newsletter to share timely insights on irrigation decisions, featuring three growers located in Nebraska. Due to the positive feedback, we are continuing the program in 2025. In each of their corn fields, we installed a set of three Watermark (Irrometer) sensors at 1-, 2-, and 3-foot soil depths to track soil moisture throughout the growing season. A rain gauge was also installed to monitor both rainfall and irrigation events. These instruments are connected to an IC-10 datalogger (Irrometer), which records data at one-hour intervals. With a telemetry system in place, the data is transmitted remotely, allowing for timely irrigation decisions.
We will also share weekly data in video format of a field with Watermark sensors at the South Central Agricultural Lab near Clay Center, Nebraska.
How to Use Soil Tension Data from Watermark Readings
In order to get familiar with the data presented in this weekly irrigation newsletter, we highly recommend reading “Irrigation Scheduling Strategies When Using Soil Water Data” (Nebraska Extension NebGuide EC3036). If you would rather take a look at videos on the topic, watch "How to Schedule Irrigations with Soil Water Data" — a great five-part video series on the CropWatch YouTube channel. The method is simple, yet accurate and can be used in the field or at the office to make precise decisions in just a few minutes.
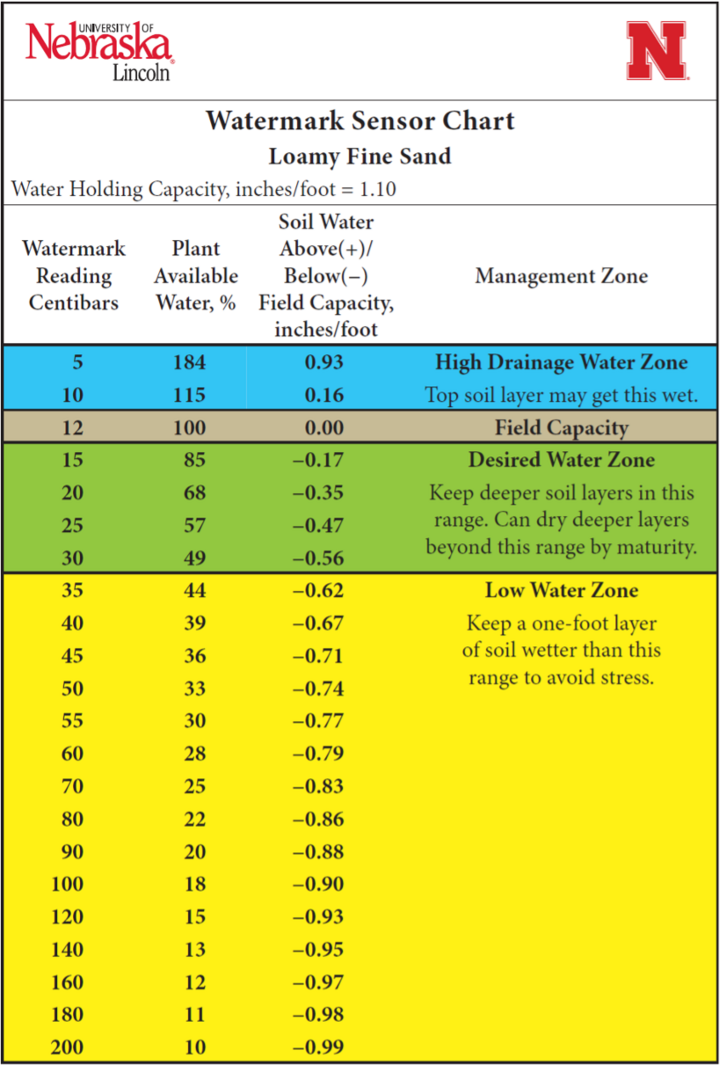
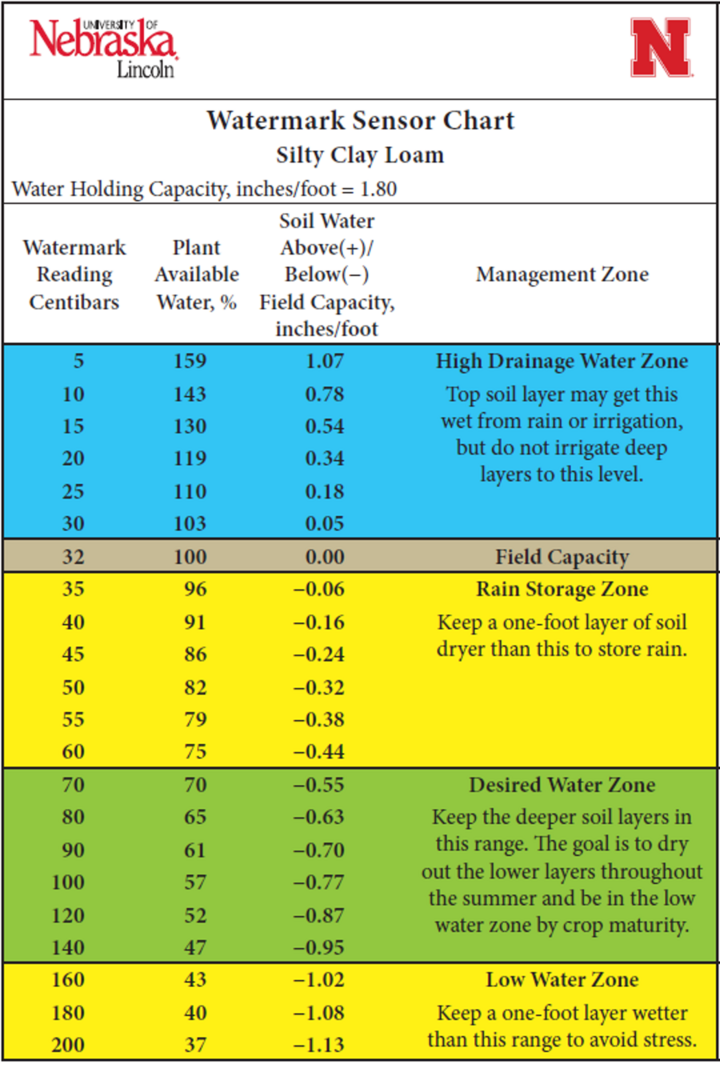
In simple terms, Watermark sensors measure soil water tension, or how tightly water is held in the soil. Lower tension values mean water is more readily available to plants, while higher tension values indicate less available water. Below are two charts (adapted from EC3036) showing the relationship between Watermark sensor readings.
Early-Season Crop Evapotranspiration and Irrigation
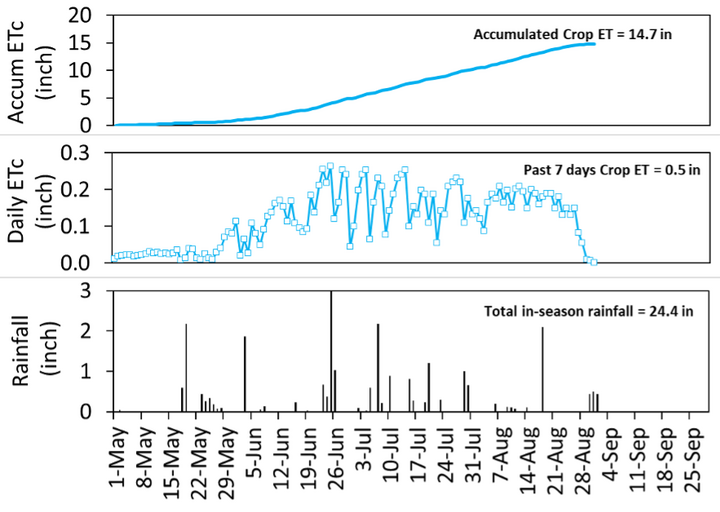
- In the past seven days, accumulated crop evapotranspiration (crop water use) was only 0.5-inch.
- The low numbers are a combination of cooler temperatures, the rainy days observed during the weekend and holiday, and the corn plants approaching maturity.
Grower’s Irrigation Decision (Aug. 26-Sept. 2)
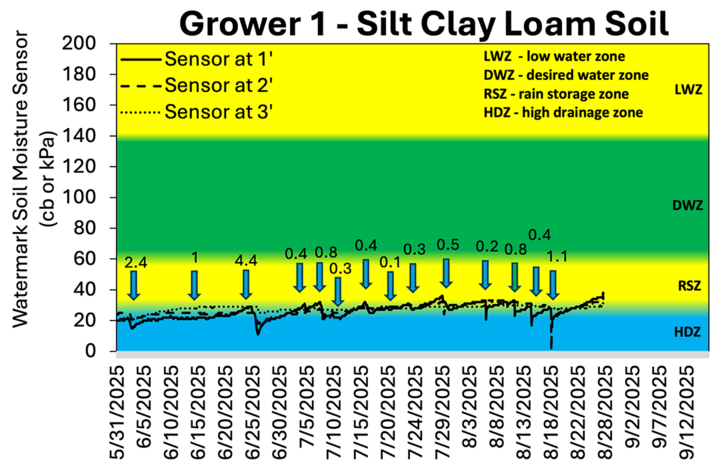
Understanding the chart:
- solid line — sensor at 1 foot soil depth
- dashed line — sensor at 2 feet soil depth
- dotted line — sensor at 3 feet soil depth
- blue arrows — rainfall in inches
- green arrows — irrigation in inches
- The soil moisture sensors were removed after the grower indicated he is done with irrigation at this site.
- The total irrigation amount in this field was 2.8 inches during the growing season, with 2 inches being applied after planting due to the early season drought and 0.8-inch being applied.
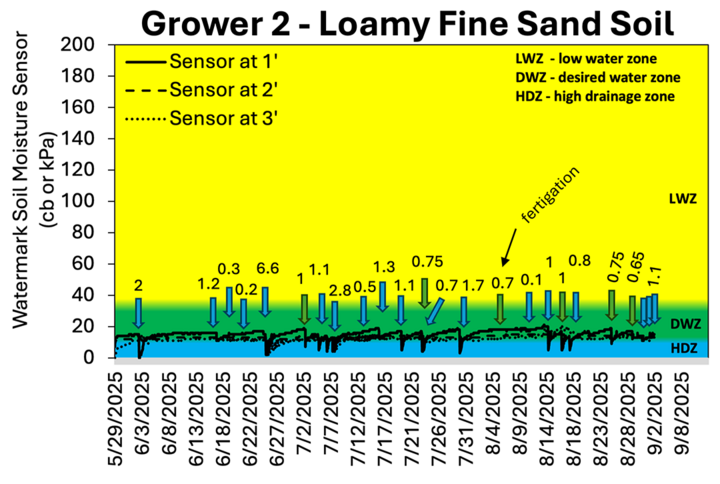
- The grower irrigated 0.65-inch on Aug. 29.
- He also indicated he might irrigate until the end of the growing season.
- Total rainfall during the weekend and holiday was 1.1 inches.
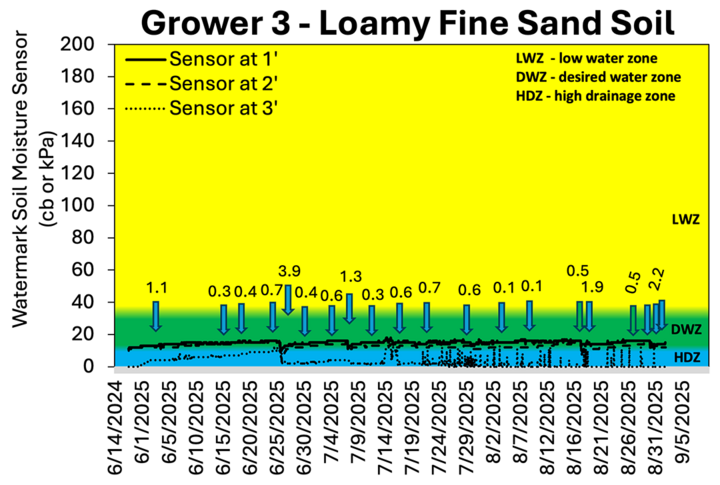
- The grower applied 0.5-inch on Aug. 28.
- This field also received 2.2 inches combined during the weekend break.
SCAL Irrigation Scheduling Video Update
Check this week's update from a set of soil moisture sensors installed at South Central Agricultural Lab in this video.
August Irrigation Scheduling Should Focus on Using Remaining Stored Soil Water
The last few irrigations of the season require some of the most important water management decisions of the year.
Calculating the amount of water needed from rain and irrigation for the crop to reach maturity becomes important starting in August. For more information, check out “August Irrigation Scheduling Should Focus on Using Remaining Stored Soil Water.”
