The extremely dry winter/spring 2022-23 was an exception for most of Nebraska, with off-season precipitation well below normal. Everyone hopes we will not experience another year like it any time soon. However, we should still look at it and see what we can learn.
A review of soil water data logs from farmers in the Upper Big Blue Natural Resources District located in the York, Nebraska area indicates more irrigators tend to overwater on wetter years than dry ones. And on very dry years like 2023, many farmers apply about the right amount of water. However, some still over-irrigate, and some under-irrigate.
The tendency should not be a surprise because humans are creatures of habit. We get out of bed every day on the same side, we sit at the same place at the table for breakfast, etc. Farmers are no different —they tend to plant about the same number of seeds per acre each year, they apply about the same amounts of fertilizer each year, they plant the rows the same direction, etc. Well, you get the point, and without any compelling reasons and if it is working, why make changes, right? However, irrigation scheduling should be an exception to this approach, because rainfall amounts and their timings are quite different each year.
The amount and timing of irrigation applied last year, or the years before, may have very little to do with the amount or timing needed for this year. The long-term average of irrigation application depth and timing is relatively meaningless for the decisions producers need to make on any given day in the current growing season. However, without any additional data, all an irrigator can do is put on about the same amount of water as in the past and make slight adjustments if the weather is dryer or wetter.
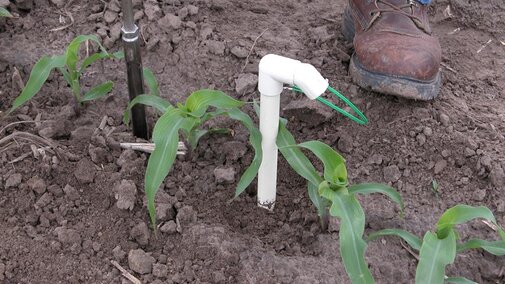
To illustrate this, let’s look at some data from the Upper Big Blue NRD. The NRD requires growers in six areas that have an increased median nitrate-nitrogen level in the groundwater, to use soil water monitoring equipment in one irrigated field and report the data collected annually. Many of the producers impacted by this rule use Watermark sensors that measure soil matric potential; thus, this study has largely focused on Watermark data for easy comparison. The soils in the NRD are mostly silt loam or similar soil texture making the field-to-field data comparable.
To protect privacy, the NRD removes names from the information prior to group analysis; therefore, the location for each field is just somewhere in the Upper Big Blue NRD.
The Analysis
The analysis focused on dividing the fields into one of six categories based on the soil water levels in the heart of the season (July and August) and on Sept. 15. The six categories were developed based on the readings from the Watermark sensors. The sensors generate data reported in centibars (cb) and have a range from 0 (wet) to 240 (dryer) centibars. Centibar is a unit of measure that refers to the force required to pull the water from the soil and into the plant. Typically, installations use a set of three sensors, with one sensor installed at 6-12 inches, one at 18-24 inches, and one at 30-36 inches. The categories are as follows:
- Good — At least one sensor out of the three depths drier than 70 cb early and one sensor drier than 70 cb on 9/15
- Fair — At least one sensor drier than 70 cb early and one sensor drier than 30 cb on 9/15
- Wet Late — At least one sensor drier than 70 cb early but no sensor drier than 30 cb on 9/15
- Wet Early — No sensor drier than 70 cb early, but one sensor drier than 30 cb on 9/15
- Wet All Season — Both sensors measuring the second and third foot not drier than 70 cb all year, but one sensor between 30 to 70 cb on 9/15
- Very Wet All Season — Both sensors measuring second and third foot not drier than 70 cb all year and no sensor drier than 30 cb on 9/15
These six categories were determined because the soil water level in a silt loam soil where deep percolation losses of water and nutrients slows to a low rate is about 70 cb; thus, it is recommended to keep at least one of the sensors in the second or third foot in this range or dryer. Yield losses would not be expected until all the sensors were approaching 140 cb, making the 70 cb level very achievable without any chance of causing yield loss. Field capacity in a silt loam is about 30 cb, so the goal is to not refill the soil above this level with irrigation in the second or third foot.
The top foot will go above field capacity (30cb) after every irrigation or heavy rain. However, if the second foot gets above 30 cb, it would indicate that over-irrigation is occurring. The 70 cb level is equal to about 70% of plant available water (PAW) and stress should not start until below 50% of PAW during the summer and 40% in late August and September. Soil types with high sand or clay content would require different levels other than 30 and 70 cb.
To fit into a category, the data needs to indicate that the field was this dry on a given day and not how many days the soil was drier than 70 cb.
The analysis found that all the fields in 2017, ‘18, and ‘19 were irrigated to a level preventing water stress all season; however, in the dry years of 2020, ’21, and ’22, 15-20% of the fields may have been slightly underwatered late in the season (it may or may not have affected the yield).
In general, about one-third of the irrigators in the study on the normal to wet years are doing a good job of applying the correct amount of water to minimize deep percolation of water and nutrients and save pumping costs while producing top yields. The other two-thirds could have saved money and water without lowering yield. In fact, about one-third could have saved a lot! On the other hand, about 60%-80% are doing a good job during the dry years, as shown in Table 1.
| Categories | 2017 86 Reports | 2018 50 Reports | 2019 15 Reports | 2020 39 Reports | 2021 53 Reports | 2022 60 Reports | 2023 47 Reports | Weighted Avg Normal to Wet Years '17, '18, '19 | Weighted Avg Dry Years '20, '21, '22, '23 |
|---|---|---|---|---|---|---|---|---|---|
| Good | 28% | 40% | 20% | 64% | 57% | 70% | 72% | 31% | 66% |
| Fair | 10% | 18% | 7% | 21% | 6% | 8% | 2% | 13% | 9% |
| Wet Late | 13% | 16% | 40% | 0% | 6% | 3% | 9% | 17% | 5% |
| Wet Early | 13% | 12% | 7% | 3% | 25% | 15% | 4% | 12% | 13% |
| Wet All Season | 22% | 10% | 0% | 5% | 4% | 2% | 4% | 16% | 4% |
| Very Wet All Season | 14% | 4% | 27% | 8% | 4% | 2% | 9% | 12% | 5% |
University of Nebraska Extension irrigation scheduling recommendations encourage irrigators to allow the crop to continue using more and more of the stored soil water starting in August and continuing into September when the crop matures. The recommendation is to lower the soil water level from the usual summer 50% minimum plant available water in the top three feet of soil to 40% plant available water in the top four feet after the dough stage (R4) is reached. Thus, the stored soil water content should be significantly lower when the crop matures in September than earlier in August.
Leaving the soil as dry as possible without lowering yields saves money on pumping costs and leaves room to store off-season precipitation. In most years, adequate precipitation will be received from October through May to refill the soil profile on fields that were fully irrigated the previous year in the entire state. A lot of years, even in the Panhandle, the two to four inches of water needed to recharge the soil will be received from rainfall or snowfall. In addition to financial savings, leaving the soil drier will help reduce harvest delays due to mud if rain is received in the fall.
Using the 40% recommendation, the data shows many irrigators are applying more water late in the season than is needed. Some years, a significant rain can cause the soil to be wetter in September, but it is usually due to applying more irrigation water than needed. The data shows that in 2017, 72% of fields were over-irrigated late in the season and even in the drought year of 2023, 47% of fields were over-irrigated late in the year.
However, the data shows that in the dry years, 2020, ’21, and ‘22, 15-20% of the irrigators let their fields get dry late in the season — maybe even dry enough to have resulted in small yield losses.
The extremely dry winter/spring 2022-23 was an exception for most of Nebraska, with off-season precipitation well below normal. This highlighted the only downside to leaving the soil dry at the end of the irrigation season. In these years, we may need to pump some water in June to refill the profile before the high water-demand days of July arrive. The data showed that some fields were at field capacity at the end of the irrigation season in 2022, but many of the silt loam soil fields would require four to five inches of water to refill the profile. The problem is, without soil water monitoring equipment, one did not know if their field was already refilled to field capacity or not. As a result, 2023 data showed about 20% of the fields likely had some yield loss because the deeper layers of soil just did not have the usual amount of stored soil water. Using the data from soil water sensing equipment would have been a good way to know how much water is stored in the soil at deeper depths to prevent the problem.
| Percent of fields that became wetter moving from August to Sept. 15 | 2017 | 2018 | 2019 | 2020 | 2021 | 2022 | 2023 | Weighted Avg Normal to Wet Years '17, '18, '19 | Weighted Avg Dry Years '20, '21, '22, '23 |
|---|---|---|---|---|---|---|---|---|---|
| Soil in the 15-25 in zone | 72% | 58% | 54% | 45% | 44% | 36% | 47% | 65% | 43% |
| Soil in the 25-36 in zone | 75% | 58% | 54% | 21% | 48% | 20% | 32% | 66% | 30% |
| Soil in both zones | 66% | 47% | 38% | 21% | 37% | 18% | 30% | 37% | 22% |
The data does not give any insight into why so many farmers over-irrigate late in the year, but it could be because the irrigation routine is set in July when the days are long, temperatures are high and the plants are transpiring at their peak. Then, as the daylight hours shorten and the temperatures get cooler in late summer, many keep irrigating at July levels even though crop water use for corn has gone from an average of two inches/week at silking to 1.25 inches/week at full dent. Again, as creatures of habit, without good soil water monitoring data to direct our irrigation scheduling, we just keep on doing what we have been doing. Other crops, including soybeans, have a similar dramatic drop in crop water use moving through August and into September.
Irrigation scheduling is one of the most important jobs on an irrigated farm. It also requires a regular time commitment each week, all summer long, to look at the data and make good decisions that will produce top yield while minimizing water use and nutrient leaching. Putting on the average amount of water that was applied to the field in the past five years will always lead to either irrigating too much or too little.
