Introduction
The U.S. High Plains, renowned for its cattle production, generates approximately 10 million metric tons of manure annually. This manure is a valuable resource, rich in organic matter, beneficial microorganisms and essential nutrients, such as nitrogen (N), phosphorus (P) and potassium (K) that are vital for crop growth. Mismanagement of manure in feedlot operations can lead to nutrient loss, groundwater contamination, compromised air quality, environmental pollution and health risks. Incorporating carbon (C)-rich additives like coal char into manure is beneficial in addressing these challenges.
Coal char — a byproduct of incomplete coal combustion at sugarbeet processing facilities — contains approximately 30% C by weight and serves as a convenient and cost-effective substitute amendment. By adding these C-rich amendments to manure, the effectiveness of the mixture is enhanced, as it captures and retains nutrients, thus improving soil fertility and reducing dependence on synthetic fertilizers. Moreover, adding C-rich amendments increases the C:N ratio, boosts total dry materials, enhances organic C inputs into the soil, and facilitates long-term soil organic carbon (SOC) accumulation.
Furthermore, incorporating these C products mitigates odors, reduces unpleasant smells and promotes livestock health. Understanding the effects of coal char on the chemical composition and stability of manure is crucial for efficient management, optimal nutrient utilization and increased crop yields in semiarid regions.
Cattle Pen Experiment
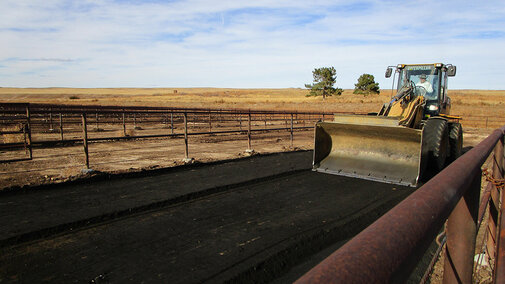
The first phase of the experiment was initiated in the fall of 2019 at the University of Nebraska-Lincoln (UNL) Panhandle Research, Extension and Education Center (PREEC), Mitchell Agricultural Laboratory cattle pens, located five miles north of Scottsbluff, Nebraska. The experimental layout was a completely randomized design with five replications. Each cattle pen with (at 6 Mg pen-1) or without char was assigned 10 heads of finishing steers. Hydra probe sensors were installed at 13-cm depth in both the char-treated and control pens to collect high-frequency soil moisture, electrical conductivity, and temperature data during the first half of January 2020 (i.e., after a series of snowstorms in November 2019).
The cattle pen experiment was completed in April 2020. Live weights of cattle were recorded at the end of the experiment. After scraping from the char-treated and control pens, subsamples of the piles were analyzed for nutrient contents.
Crop Field Experiment
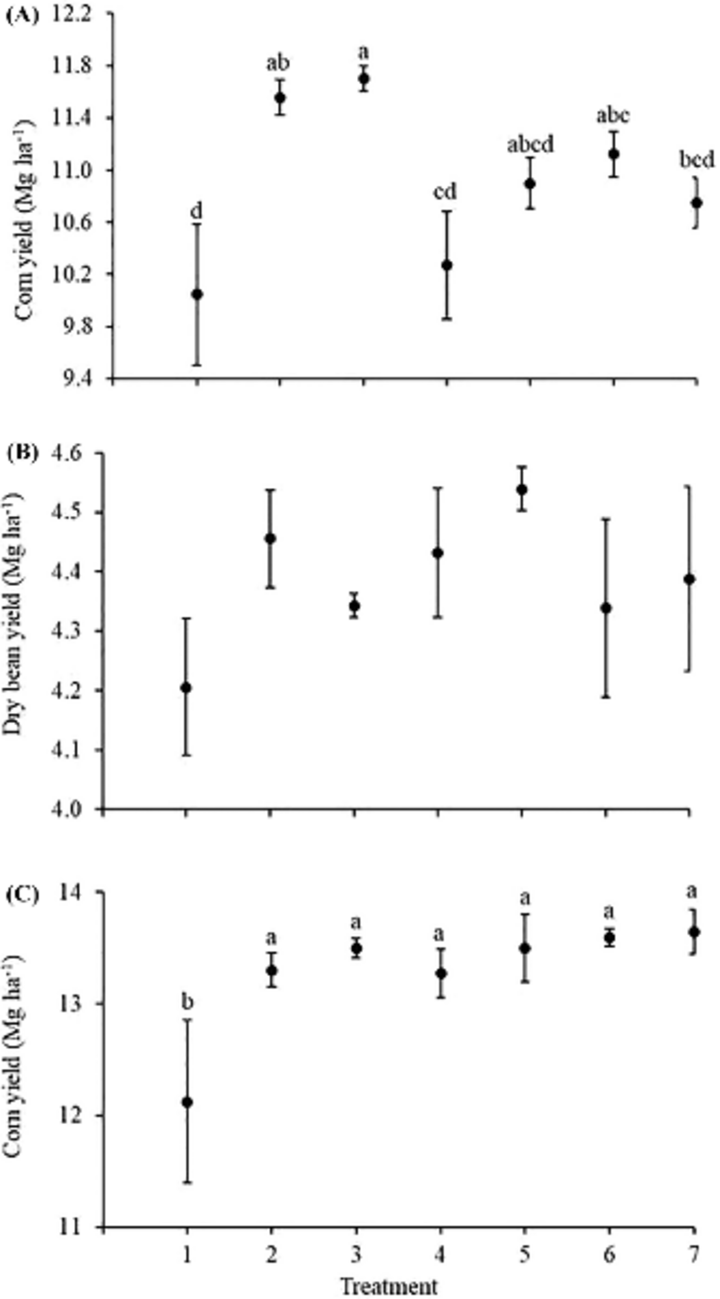
In 2020, the crop field experiment was initiated at UNL PREEC Mitchell Agricultural Laboratory, Scottsbluff, Nebraska, in a very fine sandy loam soil. The experiment was laid out in a randomized complete block design with four replications. The main factor was different N treatments, including manure from pens with or without char (each at 34 and 68 Mg ha−1; low and high rate), urea at 100% recommended N rate with or without 45 Mg ha−1 of char, and a control (0 N) (Table 1). Each year, the recommended N rate was calculated using the UNL algorithm, which accounts for the spring soil test and yield goal.
Manure and char–manure mix were obtained from the cattle pens from the first phase of the experiment. Char was brought from the sugarbeet factory, as in the pen experiment. All char, manure, and char–manure mix were uniformly spread using a manure spreader. The plot was planted with corn in 2020, dry edible beans in 2021, and corn in 2022. Management activities, including irrigation and herbicides, were uniform across all treatments.
In addition to the spring soil test to inform N and P recommendation for crops each year, soils were sampled after dry bean harvest in fall 2021 (Sept. 24, 2021) and in spring 2022 (April 25, 2022) before corn planting to determine potential overwinter nutrient losses.

| Treatment§ | 2020 Corn | 2021 Dry Bean | 2022 Corn | |||||
|---|---|---|---|---|---|---|---|---|
| Urea-N | P2O5 | Char | Manure | Char-Manure Mix | Urea-N | P2O5 | Urea-N | |
| lb ac-1 | ton ac-1 | lb ac-1 | lb ac-1 | |||||
| 1 | 0 | 60 | 0 | 0 | 0 | 0 | 20 | 0 |
| 2 | 220 | 60 | 0 | 0 | 0 | 60 | 20 | 185 |
| 3 | 220 | 60 | 20 | 0 | 0 | 60 | 20 | 185 |
| 4 | 0 | 0 | 0 | 0 | 15 | 20 | 0 | 185 |
| 5 | 0 | 0 | 0 | 0 | 30 | 0 | 0 | 185 |
| 6 | 0 | 0 | 0 | 15 | 0 | 20 | 0 | 185 |
| 7 | 0 | 0 | 0 | 30 | 0 | 0 | 0 | 185 |
§Treatments included the control; treatment 1 that received no N in all three years. Treatment 2 received 100% N each year based on the UNL algorithm accounting for crop yield goal and spring soil test, 3 received 100% N plus char from the factory in 2020, 4-7 received char-manure mix and manure alone scrapped from the cattle pens in 2020. Treatments 4 and 6 received supplemental N in 2021; all 2-7 treatments received 100% N in 2022. Treatments 1-3 received P based on spring soil tests in 2020 and 2021.
Take Home Message
- Applying char to cattle pens kept them drier following snowfall events, without affecting cattle performance.
- Char increased nutrient retention in soil and manure.
- The dilution effect of phosphorus was evident due to the addition of char to manure.
- A one-time char-manure mix or manure application at 68 Mg ha−1 could replace 314 kg N ha−1 and 90 kg P2O5 ha−1 over two years without any yield penalty.
- There was an indication of yield benefits of adding char to the 100% N treatment.
- Additional benefits of adding char to cropland include carbon input to the soil.
For more details, see this resource.


