Drought Monitor Update
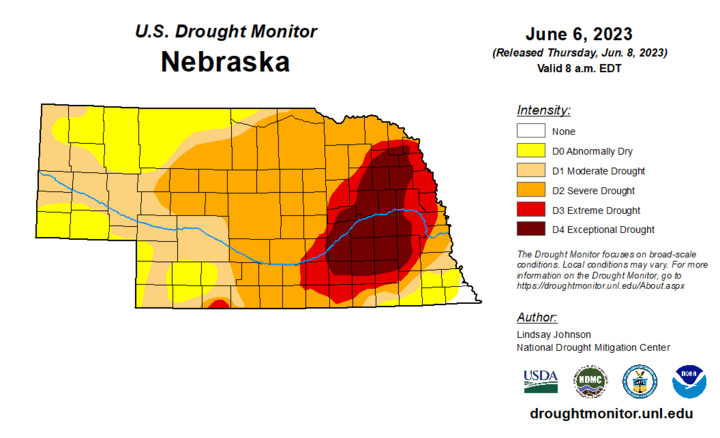
There is good news and bad news for the state on the latest U.S. Drought Monitor. The good news is a little over 20% of the state is no longer in drought. Most of western Nebraska is now either free of drought (though still classified as abnormal drought) or in moderate drought. Another week’s worth of solid rains and there may be more places in western Nebraska clear of all drought and abnormal dryness.
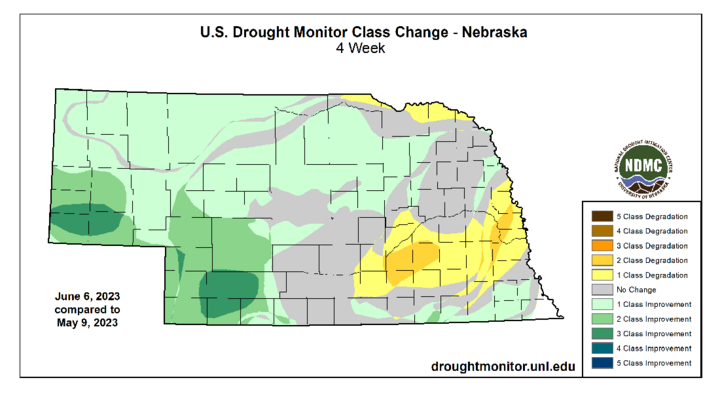
Over the last month, almost all of western Nebraska has seen a one-category improvement, and many places in southwest Nebraska and the southern Panhandle have seen two- and three-category improvements after having the wettest (or one of the wettest) May’s on record. Also on the good news side, most of Johnson County in southeast Nebraska is now free of drought, as is southern Gage County and extreme southern Jefferson County.
The bad news is a very large and growing percentage of eastern Nebraska is in severe to exceptional drought. One-category degradation was noted in Burt County and across the northern section of the state along the Highway 12 corridor. While the first modest precipitation in weeks fell across portions of the worst areas in the past week, it wasn’t enough for improvement.
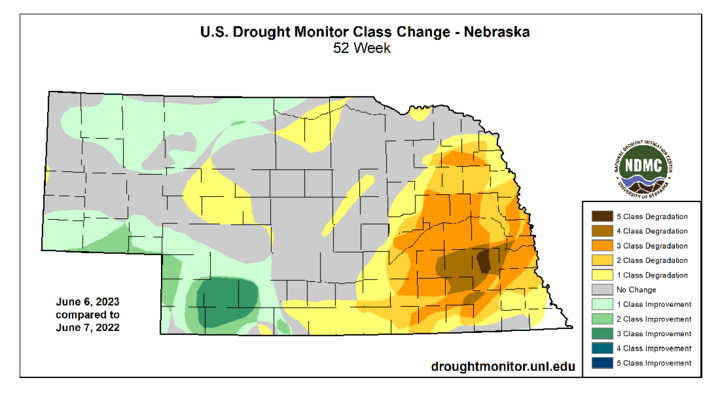
Over the course of the last year, this area has seen remarkable degradation, with parts of Lancaster County and Lincoln going from no drought or abnormal dryness to exceptional drought. Granted, the intensification came mostly in two waves and not just in three months, with the first flash drought period occurring last summer and then another occurring this spring and early summer. But the duration of the drought conditions is starting to become a significant hydrology issue, particularly in northeast Nebraska where drought has been in place for two-plus years. My prediction is there will be significant municipal water restrictions in place in six weeks if the situation doesn’t improve.
Precipitation Update
Precipitation in western Nebraska was generally less robust in the last week than it had been previous weeks, but much of the western Panhandle picked up over an inch, leading to more improvements on the Drought Monitor.
In central Nebraska, some areas along and west of Highway 281 picked up more than two inches of rain, though generally not enough to warrant drought improvement just yet.
Across the worst of the drought area in east-central Nebraska, many places had their first meaningful precipitation in over a month last Thursday. While isolated spots were fortunate enough to pick up decently over an inch, that is merely an average week for this time of year. To use a baseball analogy — if your team is 20 games under .500 or worse in June, you aren’t suddenly going to be on the path for playoff contention just by winning a few games in a week. It will take sustained above-average precipitation to start alleviating the drought, much as a baseball team would need sustained winning for weeks to get back in contention.
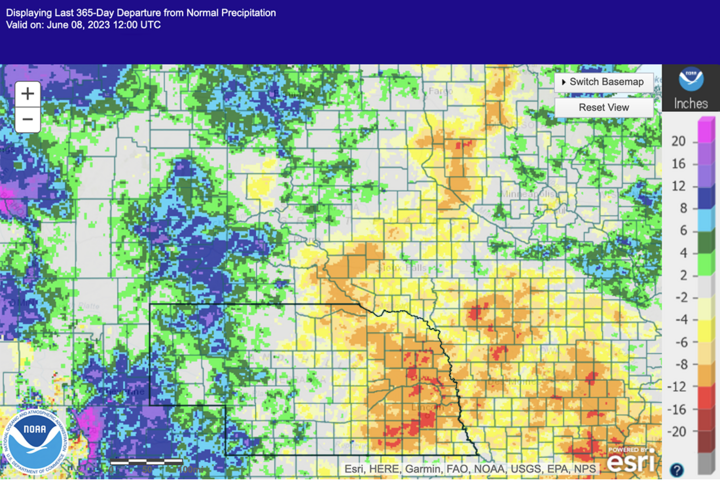
A look at the 365-day precipitation departure map helps illustrate this point further. In absolute terms, most of eastern Nebraska is running at least a 10-inch deficit, and in many places, it exceeds 12 inches. Over the last two years, deficits are starting to close in on the 20-inch mark in the Norfolk area, as total precipitation in the two-year period ending last week was the lowest such two-year period in seven decades. Many other locations in northeast Nebraska are also likely running at least a 15-inch deficit going back to the spring of 2021.
Crop Condition Update
Latest NASS statistics show some winter wheat is a bit behind average for heading and 44% poor to very poor, which is a bit better than last week’s 51% poor to very poor. It also is much better than in Kansas where two-thirds of wheat is poor to very poor.
The latest NASS update revealed 97% of corn planted (near-average) with 92% emergence, which is ahead of schedule. Initial condition reports on corn revealed 63% as good to excellent vs. 7% poor-very poor. While that good to excellent number might seem surprisingly high, that is quite low for this time of year. For example, at this point last year that number was 75%, even with much of the state in drought.
Soybean is also ahead of the five-year average for percentage planted (90%) and emerged (68%).
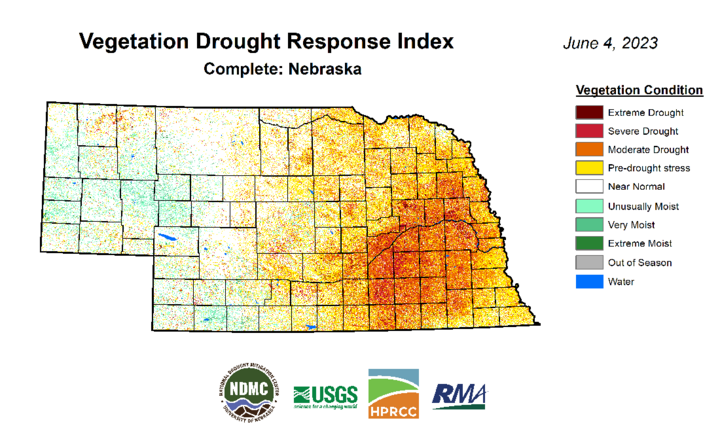
The latest NASS update showed 44% of pastures statewide are poor to very poor, with 36% considered good to excellent. While this is not great, those numbers are a big improvement over a month ago when 68% of pastures were in poor-very poor shape and only 2% in good condition. This is also reflected in the latest VegDRI update, which would indicate that most pastures in the western third of the state are healthy or at least on the road to recovery. VegDRI also shows the severity of the drought in eastern Nebraska as well.
