Sixty percent of the value of soybeans comes from its protein meal, and 40% comes from its oil, making soybean seed’s protein and oil content relevant to production. Nebraska ranks fourth in U.S. soybean production, with an average protein content of 33% and an oil content of 20% (Annual Report U.S Soybean Quality, 2021).
From a farmer’s perspective, several important reasons exist to consider soybean protein and oil content, including potential market value. Buyers such as animal feed manufacturers, food processors and biodiesel producers are willing to pay a premium for soybeans with higher protein and oil content. In order to get a premium price for their crop, these farmers must produce soybeans with higher levels of protein and oil content. Farmers have been interested in learning more about soybean protein and oil content, as shown by a recent survey conducted by Kansas State University. This survey showed that 100% of Midwest growers would be willing to invest in technology to map soybean protein variability if they could obtain a protein premium, and 75% would like to learn more about quality and how to manage protein and oil within their fields (Ciampitti, 2021).
While some studies have evaluated variability in protein and oil content between fields, research has not been done to understand how protein and oil content varies within fields. Soybean seed quality is a function of environment, genetics and management; however, the contribution of each factor to seed composition is not well understood. Given the importance of soybean protein and oil content, researchers and growers are now looking to understand how these properties vary spatially within a field and provide a useful resource for researchers, farmers and industry.

In 2022, Dr. Laila Puntel and Laura Thompson at the University of Nebraska joined the Mapping Soybean Protein and Oil Quality in Farmer Fields project led by Dr. Ignacio Ciampitti (Kansas State University), a project aimed at understanding how soybean protein and oil vary within fields.
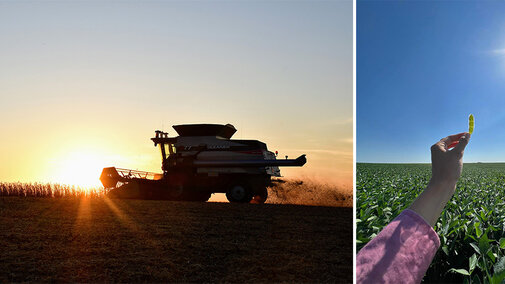
During the first year of the project, grain samples were collected at harvest in 10 fields across Nebraska (Figure 1) and analyzed for protein and oil content to explore the variability expressed within fields. The field sampling protocol utilized in-season aerial imagery of the soybean canopy to select contrasting portions of the field for sampling. The number of seed sample locations per field ranged from five to 12. Grower management practices were also documented to understand better how management influences seed composition (Table 1). Fields 3, 5 and 8 were rainfed, while the remainder were irrigated.
| Field | Yield (bu/ac) | Planting date | Maturity group | Seeding rate (seeds/ac) | Irrigation type | Irrigation (in) | Soil type | Tillage type |
|---|---|---|---|---|---|---|---|---|
| 1 | 73.1 | 4/21/22 | 2.7 | 150000 | Center Pivot | 7 | Silty Loam | No-Till |
| 2 | 72.8 | 5/11/22 | 2.8 | 140000 | Center Pivot | 30 | Sandy Loam | No-Till |
| 3 | 78.3 | 4/23/22 | 3.9 | 140000 | Rainfed | − | Silty Clay Loam | No-Till |
| 4 | 65.5 | 5/24/22 | 2.6 | 120000 | Surface | 10 | Silty Loam | Strip Till |
| 5 | 47.2 | 5/14/22 | 3.5 | 120000 | Rainfed | − | Marshall Silty Clay | No-Till |
| 6 | 86.2 | 5/16/22 | 2.7 | 141000 | Center Pivot | 8 | Silty Clay Loam | No-Till |
| 7 | 78.9 | 4/26/22 | 2.5 | 180000 | Center Pivot | 8 | Silty Loam | Strip Till |
| 8 | 68.1 | 4/27/22 | 3.9 | 140000 | Rainfed | − | Silty Clay Loam | No-Till |
| 9 | 77.2 | 5/11/22 | 2 | 160000 | Center Pivot | 7 | Silty Loam | Ridge |
| 10 | 70.1 | 4/19/22 | 2.4 | 140000 | Center Pivot | 7 | Silty Loam | No-Till |
How Much Did Soybean Quality Vary in 2022?
Soybean protein content among fields ranged from 31% to 36%, with an average of 34% (Figure 2) and oil content ranged from 18% to 22%, with an average of 20% (Figure 3). Compared to Nebraska reported values in the Annual U.S. Soybean Quality Report, observed protein content was 0.89% higher, and observed oil content was 0.75% lower. Overall, protein and oil content varied 4.5% and 5.2% respectively among fields.
The trade-off between oil and protein has been demonstrated in numerous research studies. It occurs because protein and oil have separate routes during seed development to convert the carbohydrates produced during photosynthesis. Genetic and environmental factors determine which pathway will receive more resources, and this will lead to a more significant accumulation of one or the other. This conclusion is supported by our data, which shows that the two fields with the lowest protein contents (Fields 3 and 8) have the highest oil contents.


In addition to genetics and environmental conditions, management practices such as irrigation have an impact on seed composition. Studies have shown a positive correlation between protein content and irrigation. On average, we observed higher protein content in irrigated fields (34% on average, n=7) compared to rainfed fields (31% on average, n=3).
Different numbers of samples were collected for the fields. In order to have a significant representative sampling, analysis was performed to see how the number of samples collected would relate to the CV within fields. We also found that to capture within-field variability, the optimum sampling size is eight samples per field.
Within-field Variability in Protein and Oil
The coefficient of variation (CV) is used to understand the relative variability or dispersion of the observations and is expressed in percentages to allow easy comparison across fields. Within fields, the CV for protein ranged from 1.7% (Fields 1 and 9) to 5.2% (Field 2), while oil CV ranged from 2.1% (Field 9) to 6% (Field 6). Overall, there was a greater within-field variation in oil content (3.6%) than in protein content (3.3%).
The high variability in protein content in Field 2 corresponded to a field with high variability in irrigation management. The field is characterized by contrasting soil types, and the pivot speed varies accordingly to adjust irrigation amounts. Non-uniform watering may have contributed to greater variability in protein.
The highest variability in oil content was found in Field 6, which was one of the highest-yielding fields. This was the only field designated for seed production. In a field contracted for seed, usually high-quality cultivars are selected and strict seed production protocols are followed. However, one sample was collected from this field's dryland area (corners of the pivot) with discrepant high oil content, thus contributing to high variability in this field. Additionally, this field was watered early in the season since the pivot is also used to irrigate a neighboring corn field.
Field 9 has the lowest variability for both protein and oil. Scouting during the growing season showed a very homogenous crop, effective pest control, diseases and weeds. Field 1 also had low variability for both protein and oil and was one of the fields with the highest seeding rates (150,000 pl/ac). In this field, a total of 12 samples were collected, which may have been a representative sampling of the field.
As mentioned before, higher protein content in irrigated fields was observed compared to rainfed fields. Fields 3 and 8 received 17% of the normal rainfall during August, contributing to low protein and high oil, while Field 5, also rainfed, received 51% of the normal rainfall during August and therefore did not have this same response. August is a critical month for soybean crop since it represents the growth stages R4 to R6, which is the seed filling period when nitrogen uptake by the roots and existing nitrogen in vegetative tissue begins remobilization to the seed. There, they are converted into amino acids, and the sum of all amino acids represents the protein content.
In consequence of the lowest protein contents and confirming the trade-off between protein and oil, Fields 3 and 8 had a significantly higher oil content (average of 21%) compared to the rest of the fields (average of 19%).
Field 5 supports the negative correlation between seed yield and seed protein concentration found in studies on soybean since this is the field with the highest protein content (35.55%) and the lowest yield (47.2 bu/ac). The field also had a high CV for both protein and oil, indicating notable variability within this field. Field 5 also had the lowest number of collected samples — five in total, which may not have been a representative sampling of the field.
What’s Next?
The Nebraska research team, led by Nebraska Precision Ag and Soil Fertility Specialist Dr. Laila Puntel, will continue visiting and scouting fields across the state to contribute to the multi-state database, which in the future aims to create soybean quality maps across the U.S. The multi-state project will allow the team to scale soybean quality predictions to a regional level, resulting in large-scale soybean quality improvements. Finally, the economic value of soybean quality mapping will be communicated to farmers and agronomists via an online interactive simulation tool, technical publications and social media.
Take Home Messages
- Average protein was 36% with 3.3% and 4.5% variation within and between fields.
- Oil content varied 3.6% within fields and 5.2% between fields with an average among fields of 20%.
- Genetics, environment and management practices all influenced seed quality composition.
- Having tools that help us understand how each factor contributes to seed content can be valuable to give us insights about conditions and practices such as temperature, application of nutrients, irrigation, crop rotation, planting time, etc.
- Protein and oil soybean analysis across Nebraska and Midwest will be done this coming season. Data will be used with the goal of generating maps to predict protein and oil quality from satellite images at a regional level.
