Introduction
Interest in interseeding cover crops into living corn and soybean has increased in recent years. In a companion article, we share what we’ve learned thus far from interseeding cover crops into living corn and soybean. This article will focus on the results of studies conducted via Nebraska On-Farm Research and via Soybean Management Field Days.
Nebraska On-Farm Research Studies: Interseeding into Corn
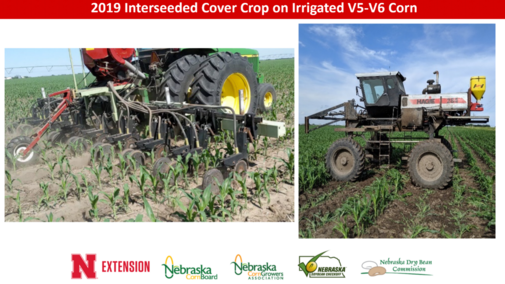
The Nebraska On-Farm Research studies were conducted at two locations in York and Seward counties (interseeded into V5-V6 corn) in 2019 (Figure 1) and at six locations in Seward, York, Clay and Hamilton counties (interseeded into V4 corn) in 2020 (Table 1). In 2020, four of the six locations compared an interseeded cover crop to a check treatment of no cover crop. One location compared two corn populations (27,000 vs. 31,000 seeds/ac) to determine corn yield and cover crop biomass impacts. One location compared using only the middle drill unit to interseed the cover crop vs. using all three drill units between the rows to determine any differences in cover crop biomass.
| ID | Report ID | County | Cover Crop Mix | Interseeding Date | Row Direction | Irrigation |
|---|---|---|---|---|---|---|
| 2020-1 | 0145159202001 | Seward | Diversity Mix | 6/1/20 | East-West | SDI |
| 2020-2 | 0580035202001 | Clay | Nitrogen Mix | 6/3/20 | North-South | Pivot |
| 2020-3 | 0916185202002 | York | Custom Mix | 6/1/20 | North-South | Pivot |
| 2020-4 | 0618159202001 | Seward | Diversity Mix | 6/8/20 | East-West | Pivot |
| 2020-5 | 0073081202001 | Hamilton | Diversity Mix | 6/3/20 | East-West | Pivot |
| 2020-6 | 0918159202001 | Seward | Diversity Mix | 6/8/20 | North-South | Pivot |
Results: Biomass
In 2019, the cover crop at the Seward County location emerged and then died, we hypothesize, due to reactivation of Group 27 herbicide. Thus, no biomass samples were taken. At the York County location, cover crop biomass sampled prior to the first hard freeze ranged from 97-220 lbs/ac. It was good to see successful establishment at both locations and that cover crop growth occurred at one of them.
In 2020, cover crop biomass samples were taken at the end of September 2020 by taking three 30”x30” or 36”x36” squares for each treatment (depending on row spacing). The samples were sorted in the field into weeds, interseeded forbs/legumes, and interseeded grasses and placed in separate paper bags. Samples were weighed and dried. We wanted to compare any differences in weed biomass between the check and interseeded treatments.
Only at site 2020-3 was there a difference in weed biomass between the check and interseeded cover crop treatments. The weed biomass at this site was greater for the interseeded treatment as the check was cultivated for weed control, resulting in lower weed pressure (Figure 3). There was 45% greensnap at site 2020-5 due to a July 9, 2020 windstorm.
The open canopy resulted in greater weed and cover crop biomass. Total cover crop biomass accumulated varied by site and ranged from a minimum of 277 lb/ac at site 2020-2 to a maximum of 3818 lb/ac at site 2020-4. It should be noted that cover crop biomass continued to accumulate until the first hard freeze; these numbers don’t account for any additional accumulation.
Soil

Soil samples were taken in early September to determine any nutrient and biological differences between the check treatments and the interseeded ones. Haney and Phospholipid Fatty Acid (PLFA) tests were taken to determine beginning soil health and microbial parameters, but to aid in cost savings, the data was not analyzed by replication. The sites were not combined for statistical analysis for the soil nutrient levels; however, results from individual sites can be viewed on pages 136-147 of the 2020 Nebraska On-Farm Research results book.
In general, the trend observed was lower soil nitrate and potassium in the interseeded treatments compared to the check strips. We observed the cowpeas, hairy vetch, sweetclover and forage soybean fixing nitrogen in the growing season of 2020. The hairy vetch and red clover that survived the winter were fixing nitrogen in May 2021. We plan to take soil samples in the spring of 2021 and corn tissue samples in 2021 to determine any additional nitrogen benefit that could be contributed to the legume cover crops.
Yield
In 2019, there were no yield differences between the corn in the check treatments (241 and 258 bu/ac) vs. cover crop interseeded treatments (241 (N mix), 243 (diversity mix), and 256 bu/ac) at the York and Seward locations, respectively. Net return was less for the interseeded cover crop treatments vs. the check. The 2019 results and additional details can be viewed at this link.
In 2020, a July 9 windstorm impacted the area of the state where these studies occurred. Hybrids varied in their development stages and varied in their response (regarding bending or breaking). Both responses impacted yields. Yield from the studies were analyzed as a large group by comparing the check and interseeded treatments (Figure 3). There was no interaction of site and treatment; therefore, treatments are examined across all sites.
Across all the sites, corn yield for the check averaged 214 bu/ac while corn yield for the interseeded treatment yielded 209 bu/ac (p-value=0.001). At four of the six sites, yield was significantly lower where the interseeded cover crop was used (sites 2020-2, 2020-3, 2020-5, and 2020-6). At the remaining two sites (2020-1 and 2020-4) yield was not different between treatments. Net return for the corn where the cover crop was interseeded was less at five of the six locations (Figure 3). Net return includes the yield and price of the corn crop and cost of cover crop seed and application. In the future, any benefits observed such as reduced nitrogen, herbicide cost, etc. due to the cover crop could be factored in the net return calculation.
Other than the York County location (two years), all the location data is based on one year of research. These studies will continue in the same fields and strips for at least three years, so it will be interesting to watch for any changes in soil biological and physical properties over time as well. Visually, in the field where the center drill unit vs. three were used, it appeared that the one drill unit had more biomass. Statistically, it ended up the same as the three drill units for total cover crop biomass. At the York location where cover crops were interseeded into two corn populations, there were no yield differences between the corn populations; however, both yielded less than the check treatment.
A special thanks to all the growers working with us on these interseeding cover crop studies and to The Nature Conservancy, Upper Big Blue NRD, NRCS, and Kellogg’s for their partnership with Nebraska Extension on this effort.

* Means statistically significant at the 90% confidence level.
Soybean Management Field Day Studies: Interseeding into Soybean
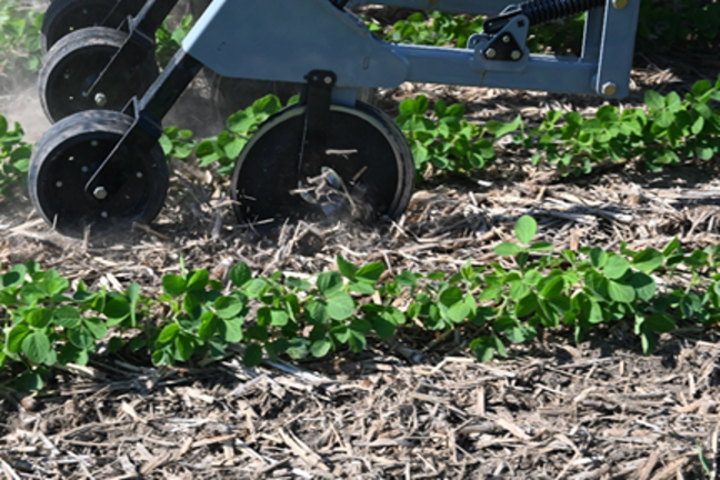
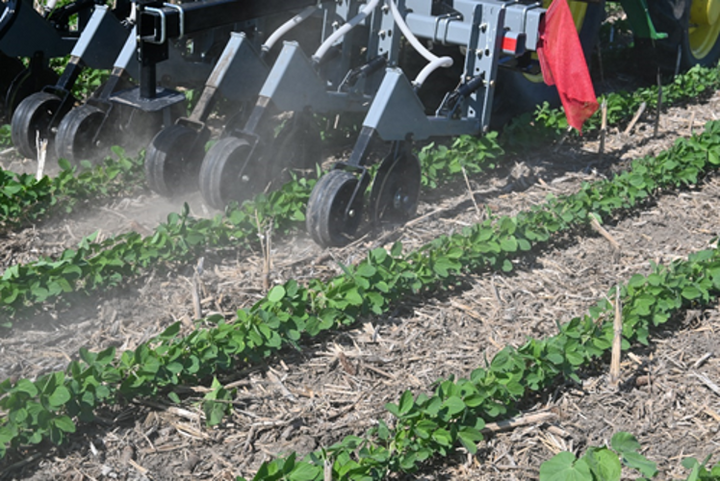
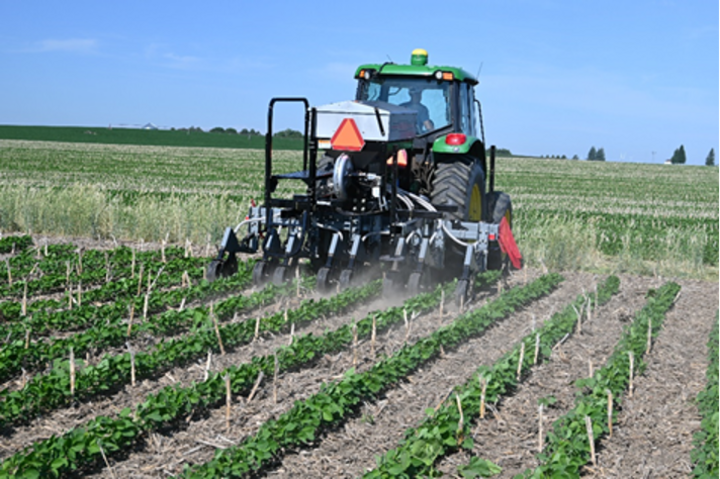
Studies were established at all 2020 Soybean Management Field Day locations (Arlington, Shelby, Elgin, Hildreth). A cover crop mix of annual rygrass (2lb/a) and winter wheat (10 lb/a) was drilled interseeded using a Hiniker cover crop drill interseeder at soybean V3 growth stage (Figure 4). Standard height and short-stature soybean varieties planted at 100,000 seeds/acre were used. Two herbicide programs (Preemergence followed by Postemergence (PRE fb POST) and POST only) were tested. The PRE herbicide application was Valor at 3 oz/A applied at planting and the POST application was Roundup at 32 fl oz./A plus applied prior to cover crop interseeding. Soybean planting and cover crop interseeding dates are listed in Table 2. Data collected includes cover crop biomass, weed suppression following POST application, and soybean grain yield.
| Site | Cover Crop Interseeded | Soybean Planted | Soybean Variety | Herbicide | |||
|---|---|---|---|---|---|---|---|
| Standard | Short | PRE | POST | ||||
| Arlington | June 24 | May 11 | 2.3 | 3.3 | May 11 | June 24 | |
| Shelby | June 24 | May 18 | 2.7 | 3.7 | May 18 | June 24 | |
| Elgin | June 25 | May 19 | 2.0 | 3.0 | May 19 | June 25 | |
| Hildreth | June 25 | May 12 | 2.5 | 3.6 | May 12 | June 25 | |
Data Collection
Yield: Soybean yields were taken using a small plot combine by harvesting the center two rows of each plot. Alleys were cut just prior to harvest and recorded to determine total plot length. All yields were adjusted to 13% moisture prior to the statistical analysis.
Statistical analysis. The experimental data was analyzed to evaluate cover crop effects on yield. Significant differences are based on a probability of a = 0.05.
Results
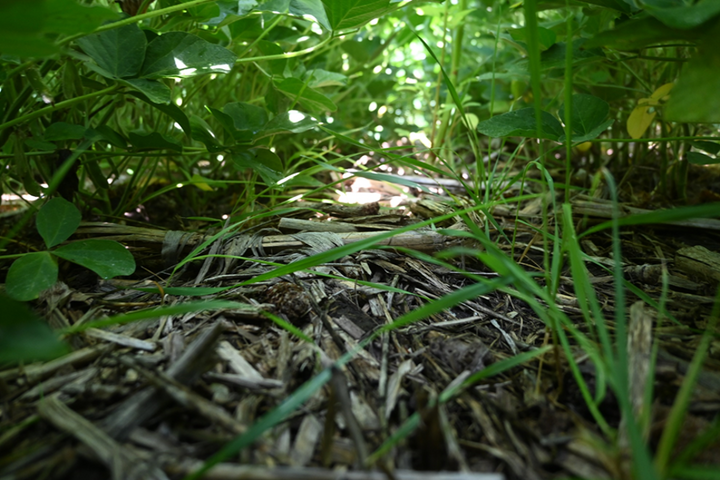
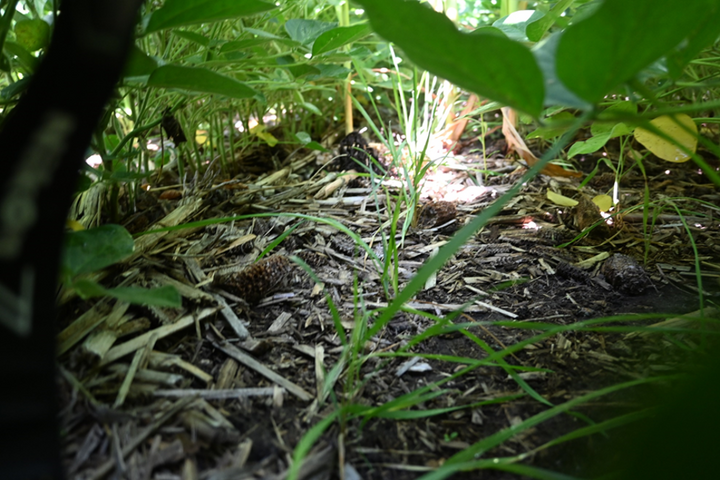
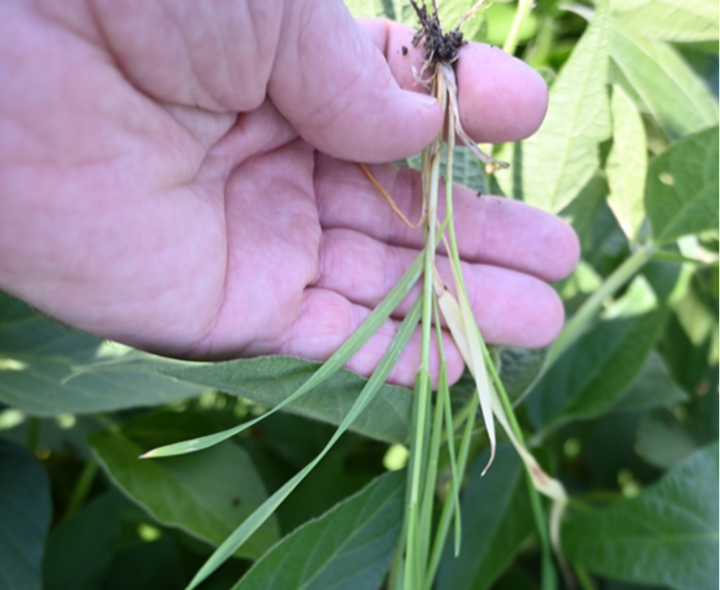
Cover Crop biomass: It was observed that wheat cover crop emergence following planting, but all cover crop treatments died under soybean canopy cover by the end of the season.
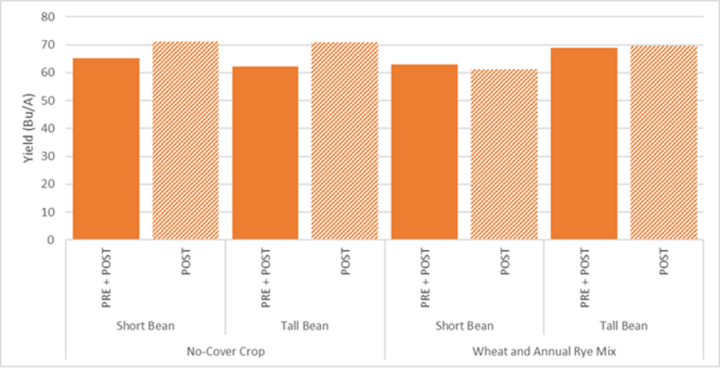
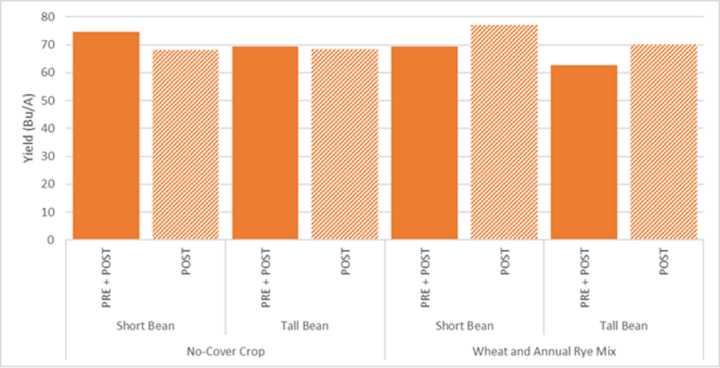
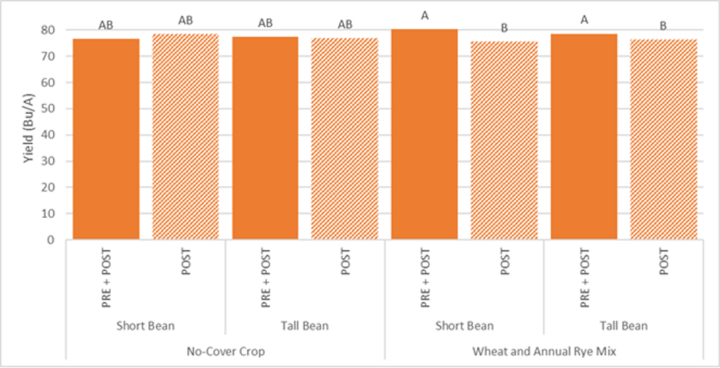
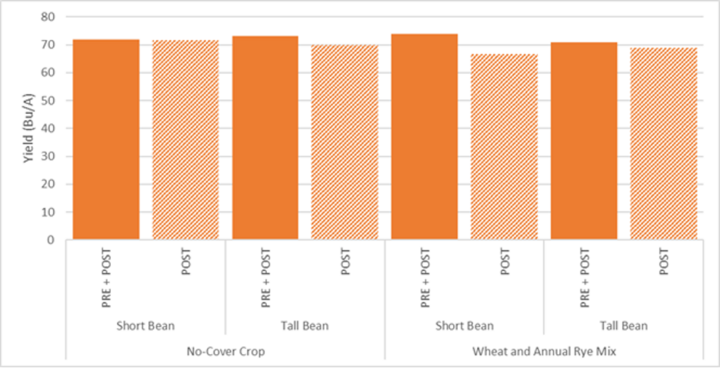
Yield: There was a cover crop by herbicide interaction for the Elgin location where preemergence plus postemergence herbicide treatment resulted in higher yields with the wheat and annual rye cover crop mix compared to the postemergence only herbicide treatment (Figure 8). There were no other yield differences for any of the other study locations (Figures 6, 7 and 9).
Discussion
For interseeded cover crops, light availability mid-season is often the most limiting factor affecting growth and survival. The study selected grass cover crops that have some shade tolerance, reduced soybean population from 130,000 seed per acre to 100,000 seed per acre and tested a shorter soybean variety to determine what effect this may have on cover crop survival. At the conclusion of this study, it was determined that these did not have a significant enough effect on light penetrating through the soybean canopy mid-season to result in season-long cover crop growth. In addition, there were almost no treatment effects on soybean yield.
A follow-up to this study has been planned for future SMFDs to evaluate the timing of cover crop interseeding/planting (fall planted, at soybean planting, and V3 soybean growth stage), soybean variety, (determinate vs. indeterminant), and soybean plant population. We will also test the use of banded compared to broadcast preemerge herbicide application in combination with cover crop treatments to evaluate the effects on weed suppression. We have concluded that additional investigation and testing is needed to determine if cover crop interseeding in soybean is a viable option for Nebraska soybean growers.
*Acknowledgements: The authors would like to acknowledge the following for helping with the on-farm research studies: Our colleagues Melissa Bartels and Michael Sindelar, who aided in biomass sampling, and graduate students Morgan Grabau and Alyssa Kuhn, who helped with weighing and drying biomass samples.
Helpful Resources
Nebraska On-Farm Research Virtual Field Day Interseeding Videos:
- Interseeding drills: https://cropwatch.unl.edu/interseeding-cover-crops-steve-melvin-june-12-2020
- Interseeding into Soybean: https://cropwatch.unl.edu/interseeding-cover-crops-soybeans-steve-melvin-june-10-2020
- Interseeding studies: https://youtu.be/gQKAGzkweG4
- Interseeding Mixes: https://youtu.be/b64PCMV1pwc
- Interseeding and Herbicide programs: https://youtu.be/5P8tE3oQ7hA
