LINCOLN, Neb. — When drought develops somewhere across the country, news reports often chronicle its effects on that area. These reports can be vital resources in trying to understand the impact of drought in the U.S., said National Drought Mitigation Center assistant director Kelly Smith. The Drought Center has developed a mostly automated news search process for drought impacts, and is mapping and qualifying the results. The experiential Media Drought Index (MDI), now available to the public, may help detect emerging impacts, said Smith, who led its development.
“People talk about the news as the rough draft of history,” said Smith, a former newspaper reporter. “So, this is why we use news to collect drought impacts. It has been the one source of drought impact information that is the most systematically curated over time since the Drought Center opened its doors in 1995. In 2005, we started adding them, by hand, to the Drought Impact Reporter. Now we have the Media Drought Index.”
Both the Media Drought Index and the Drought Impact Reporter are part of the Drought Impacts Toolkit, which has been developed with support from the U.S. Department of Agriculture and the National Integrated Drought Information System, and is included in the U.S. Climate Resilience Toolkit.
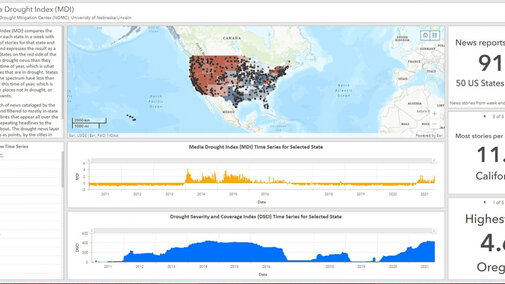
Smith said that the MDI was created to help researchers, climatologists and the public in their efforts to track drought impacts and to see where drought-related news is being published at higher or lower rates than normal, based on 10 years of data collected via the Meltwater media tracking database. States each receive an MDI score that quantifies how many more news reports a state is generating than normal for that state and time of year. The map of state MDI levels is updated each Monday. As expected, states in red, signifying high levels of drought-related news, also tend to be experiencing prolonged or intense drought.
Below the map are time series charts, showing the MDI and a statistical summary of the U.S. Drought Monitor over time, providing a comparison of attention to drought and drought conditions.
In addition to quantifying news, the MDI dashboard lets users read it. Linked news reports dot the map according to where they were published.
“It's a resource that can be helpful if you're thinking, ‘Oh, I wonder what's happening in this place,’” Smith said. “It's a map-based way to find the news, which is kind of interesting for place-to-place comparisons.”
Already, state climatologists have used the MDI to monitor impacts and provide relevant information about drought conditions to U.S. Drought Monitor authors, who consider on-the-ground reports as they create the weekly snapshot of drought across the country and its territories. The MDI is also a step toward creating a spatially continuous layer of drought impact data that is comparable to climate data, Smith said.
The Media Drought Index is now publicly available at this link.
