Introduction to Insect Degree-day Models
The importance of knowing when an insect pest will cause damage in a field is essential to producers and crop consultants when making management decisions. Since insect development is greatly affected by temperature, the timing of insect emergence can be estimated accurately by using a combination of calendar dates and assessment of temperature variations from year to year.
The use of a degree-day model can help provide producers with accurate data. Degree-days measure the amount of heat between upper and lower thresholds to which an insect has been exposed. A model for the western bean cutworm (WBC) has been developed by entomologists from the University of Minnesota and the University of Nebraska.
Each degree-day model is different, but most models will subtract the lower threshold from the average temperature for each day. For example, in the model developed for WBC, if a certain day had a low of 55°F and a high of 65°F, and the model has a lower threshold of 38°F and an upper threshold of 75°F, then the degree-days would be as follows:
[(65+55)/2]-38
[120/2]-38 = 22°F degree-days
Note: If the average temperature is less than the lower threshold (38°F), then you should use the lower threshold as the average temperature. If the average temperature is greater than the upper threshold (75°F), then you should use the upper threshold prior to subtracting the lower threshold.
Western Bean Cutworm Degree-day Model
Entomologists from the University of Nebraska-Lincoln (Tom Hunt and Robert Wright), and the University of Minnesota (Roger Moon, Bill Hutchison and Anthony Hanson) developed the most recent degree-day model. The lower threshold is 38°F while the upper threshold is 75°F beginning on March 1. Once 2,577 degree-days Fahrenheit is reached, 25% of the WBC flight occurs and scouting of corn fields should begin. (Pheromone trapping in dry bean fields should begin the last week of June before any WBC have emerged.)
If an insecticide application is warranted, it should be made 10-21 days after peak flight in dry bean and when 95% of plants have tasseled in corn. For more information, see NebGuide G2013 by Seymour et al. 2010.
| °Days F (±95% Confidence Interval) | % WBC Flight |
|---|---|
| 2,377 (1,843 - 3,066) | 5 |
| 2,456 (2,147 - 2,809) | 10 |
| 2,577 (2,416 - 2,749) | 25 |
| 2,704 (2,577 - 2,838) | 50 |
| 2,838 (2,660 - 3,027) | 75 |
| 2,977 (2,603 - 3,046) | 90 |
| 3,077 (2,385 - 3,968) | 95 |
Predicted Dates of WBC Flight for Nebraska and Surrounding States in 2022
The estimated dates for WBC flight are similar to the year 2021. WBC moths prefer to lay their eggs on the corn plant when it is approaching tassel emergence, as the tassel will be used as the primary food source for newly hatched WBC larvae.
Another source for Degree-days in your area is UNL’s AgriTools mobile app for Apple or Android.
Recorded temperatures were taken from the High Plains Regional Climate Center (HPRCC) or the National Oceanic and Atmospheric Administration (NOAA) stations from March 1 to June 12. A 10-year (2012-2021) average was used in order to predict the dates following June 12. Additionally, if a weather station did not have data available for a specific year, a weather station that was no more than 10 miles away was used, and if a station was not present then an average of data from three surrounding stations was used. If data were missing for a few days, then two nearby stations were averaged.
It should be noted that there are two possibilities of error:
- Error in the predicted temperatures for the dates after June 12.
- Error within the model.
For example, the predicted 25% peak flight in Kearney, Nebraska was said to take place on July 8 in 2021, but the actual peak flight occurred on July 9. Degree-day accumulation can be found on the UNL’s Mesonet website (select “Western Bean Cutworm GDD” in the drop-down menu).
| Municipality | Coordinates | Elev. | 5% | 10% | 25% | 50% | 75% | 90% | 95% |
|---|---|---|---|---|---|---|---|---|---|
| Alliance, NE | 42.17 -102.93 | 4072 | 22-Jul | 24-Jul | 27-Jul | 31-Jul | 4-Aug | 9-Aug | 12-Aug |
| Ainsworth, NE | 42.57 -99.83 | 2500 | 15-Jul | 18-Jul | 21-Jul | 24-Jul | 28-Jul | 1-Aug | 4-Aug |
| Alda, NE | 40.88 -98.52 | 1923 | 4-Jul | 6-Jul | 9-Jul | 13-Jul | 17-Jul | 21-Jul | 23-Jul |
| Arthur, NE | 41.45 -101.72 | 3589 | 15-Jul | 17-Jul | 20-Jul | 24-Jul | 27-Jul | 31-Jul | 3-Aug |
| Axtell, NE | 40.52 -99.05 | 2198 | 5-Jul | 7-Jul | 10-Jul | 14-Jul | 17-Jul | 21-Jul | 24-Jul |
| Big Springs, NE | 41.15 -102.00 | 3701 | 13-Jul | 16-Jul | 19-Jul | 22-Jul | 26-Jul | 30-Jul | 2-Aug |
| Broadwater, NE | 41.68 -102.87 | 4117 | 17-Jul | 19-Jul | 23-Jul | 26-Jul | 30-Jul | 3-Aug | 6-Aug |
| Brule, NE | 41.02 -101.97 | 3474 | 12-Jul | 14-Jul | 18-Jul | 21-Jul | 25-Jul | 29-Jul | 1-Aug |
| Central City, NE | 41.10 -98.05 | 1713 | 6-Jul | 8-Jul | 12-Jul | 15-Jul | 19-Jul | 22-Jul | 25-Jul |
| Clay Center, KS | 39.42 -97.15 | 1273 | 26-Jun | 29-Jun | 2-Jul | 5-Jul | 9-Jul | 13-Jul | 15-Jul |
| Clay Center, NE | 40.52 -98.05 | 1788 | 5-Jul | 7-Jul | 10-Jul | 13-Jul | 17-Jul | 21-Jul | 24-Jul |
| Columbus, NE | 41.46 -97.33 | 1450 | 4-Jul | 7-Jul | 10-Jul | 13-Jul | 17-Jul | 21-Jul | 23-Jul |
| Concord, NE | 42.38 -96.97 | 1545 | 12-Jul | 14-Jul | 18-Jul | 21-Jul | 25-Jul | 29-Jul | 1-Aug |
| Cozad, NE | 40.97 -99.95 | 2562 | 9-Jul | 11-Jun | 15-Jul | 19-Jul | 22-Jul | 26-Jul | 29-Jul |
| Douglas, WY | 42.8 -105.45 | 4892 | 2-Aug | 5-Aug | 9-Aug | 13-Aug | 17-Aug | 22-Aug | 25-Aug |
| Dunning, NE | 41.9 -100.17 | 2782 | 14-Jul | 16-Jul | 19-Jul | 23-Jul | 26-Jul | 31-Jul | 3-Aug |
| Elgin, NE | 41.93 -98.2 | 2064 | 10-Jul | 13-Jul | 16-Jul | 19-Jul | 23-Jul | 27-Jul | 30-Jul |
| Emmet, NE | 42.47 -98.77 | 2011 | 13-Jul | 15-Jul | 19-Jul | 22-Jul | 26-Jul | 30-Jul | 2-Aug |
| Firth, NE | 40.57 -96.62 | 1381 | 2-Jul | 4-Jul | 7-Jul | 11-Jul | 14-Jul | 18-Jul | 21-Jul |
| Fordyce, NE | 42.75 -97.35 | 1460 | 11-Jul | 13-Jul | 16-Jul | 20-Jul | 23-Jul | 27-Jul | 30-Jul |
| Ft. Collins, CO | 40.58 -105.15 | 1543 | 17-Jul | 19-Jul | 22-Jul | 26-Jul | 30-Jul | 3-Aug | 6-Aug |
| Garden City, KS | 37.98 -100.82 | 2841 | 26-Jun | 28-Jun | 1-Jul | 5-Jul | 8-Jul | 12-Jul | 15-Jul |
| Gordon, NE | 42.75 -102.18 | 3652 | 23-Jul | 25-Jul | 28-Jul | 1-Aug | 5-Aug | 9-Aug | 12-Aug |
| Gothenburg, NE | 40.95 -100.20 | 2628 | 9-Jul | 12-Jul | 15-Jul | 18-Jul | 22-Jul | 26-Jul | 29-Jul |
| Grant, NE | 40.85 -101.72 | 3402 | 12-Jul | 14-Jul | 17-Jul | 21-Jul | 24-Jul | 28-Jul | 31-Jul |
| Guide Rock, NE | 40.08 -92.28 | 1742 | 30-Jun | 2-Jul | 5-Jul | 9-Jul | 12-Jul | 16-Jul | 19-Jul |
| Harvard, NE | 40.57 -98.15 | 1824 | 6-Jul | 8-Jul | 11-Jul | 15-Jul | 19-Jul | 22-Jul | 25-Jul |
| Hayes Center, NE | 40.55 -101.03 | 3064 | 8-Jul | 10-Jul | 14-Jul | 17-Jul | 21-Jul | 25-Jul | 27-Jul |
| Holdrege, NE | 40.5 -99.37 | 2323 | 6-Jul | 8-Jul | 12-Jul | 15-Jul | 19-Jul | 23-Jul | 25-Jul |
| Holyoke, CO | 40.48 -102.10 | 3694 | 14-Jul | 16-Jul | 19-Jul | 23-Jul | 27-Jul | 31-Jul | 3-Aug |
| Idalia, CO | 39.72 -102.32 | 3930 | 11-Jul | 13-Jul | 16-Jul | 19-Jul | 23-Jul | 27-Jul | 30-Jul |
| Kearney, NE | 40.72 -99.02 | 2129 | 5-Jul | 7-Jul | 10-Jul | 14-Jul | 17-Jul | 21-Jul | 24-Jul |
| Keystone, NE | 41.18 -101.65 | 1033 | 10-Jul | 12-Jul | 16-Jul | 19-Jul | 23-Jul | 27-Jul | 29-Jul |
| Lamar, CO | 37.97 -102.60 | 3734 | 27-Jun | 29-Jun | 3-Jul | 6-Jul | 10-Jul | 13-Jul | 16-Jul |
| Lexington, NE | 40.72 -99.75 | 2385 | 7-Jul | 9-Jul | 13-Jul | 16-Jul | 20-Jul | 23-Jul | 26-Jul |
| Lingle, WY | 42.13 -104.38 | 4186 | 21-Jul | 23-Jul | 26-Jul | 30-Jul | 3-Aug | 7-Aug | 10-Aug |
| Lincoln, NE | 40.72 -96.62 | 1394 | 30-Jun | 2-Jul | 6-Jul | 9-Jul | 13-Jul | 17-Jul | 19-Jul |
| Manhattan, KS | 39.2 -96.6 | 1050 | 24-Jun | 26-Jun | 29-Jun | 3-Jul | 6-Jul | 10-Jul | 13-Jul |
| Memphis, NE | 41.15 -96.42 | 1145 | 6-Jul | 8-Jul | 11-Jul | 14-Jul | 18-Jul | 22-Jul | 25-Jul |
| Merna, NE | 41.45 -99.78 | 2641 | 13-Jul | 15-Jul | 19-Jul | 22-Jul | 26-Jul | 30-Jul | 2-Aug |
| Mitchell, NE | 41.95 -103.70 | 4114 | 17-Jul | 19-Jul | 22-Jul | 26-Jul | 30-Jul | 3-Aug | 6-Aug |
| Mullen, NE | 42.45 -100.90 | 3091 | 16-Jul | 18-Jul | 21-Jul | 25-Jul | 28-Jul | 2-Aug | 5-Aug |
| Naper, NE | 42.83 -99.27 | 2001 | 15-Jul | 17-Jul | 20-Jul | 24-Jul | 28-Jul | 1-Aug | 4-Aug |
| Nebraska City, NE | 40.70 -95.90 | 1079 | 2-Jul | 4-Jul | 8-Jul | 11-Jul | 15-Jul | 18-Jul | 21-Jul |
| North Platte, NE | 41.08 -100.78 | 2841 | 10-Jul | 12-Jul | 16-Jul | 19-Jul | 23-Jul | 26-Jul | 29-Jul |
| Oakland, NE | 41.83 -96.55 | 1348 | 9-Jul | 11-Jul | 14-Jul | 18-Jul | 21-Jul | 25-Jul | 28-Jul |
| Ord, NE | 41.62 -98.95 | 2060 | 12-Jul | 14-Jul | 17-Jul | 21-Jul | 24-Jul | 28-Jul | 31-Jul |
| Oshkosh, NE | 41.48 -102.35 | 3763 | 13-Jul | 16-Jul | 19-Jul | 22-Jul | 26-Jul | 30-Jul | 2-Aug |
| Powell, WY | 44.7764 -108.7590 | 4372 | 31-Jul | 2-Aug | 6-Aug | 10-Aug | 15-Aug | 20-Aug | 23-Aug |
| Riverton, WY | 43.0307 -108.3743 | 4955 | 25-Jul | 28-Jul | 31-Jul | 6-Aug | 8-Aug | 12-Aug | 15-Aug |
| Ragan, NE | 40.32 -99.38 | 2300 | 6-Jul | 8-Jul | 12-Jul | 15-Jul | 19-Jul | 23-Jul | 25-Jul |
| Scandia, KS | 39.82 -97.85 | 1480 | 3-Jul | 5-Jul | 8-Jul | 12-Jul | 15-Jul | 19-Jul | 22-Jul |
| Scottsbluff, NE | 41.88 -103.68 | 3934 | 16-Jul | 19-Jul | 22-Jul | 25-Jul | 29-Jul | 2-Aug | 5-Aug |
| Sidney, NE | 41.22 -103.03 | 4331 | 19-Jul | 21-Jul | 24-Jul | 28-Jul | 1-Aug | 5-Aug | 8-Aug |
| Smithfield, NE | 40.57 -99.70 | 2530 | 8-Jul | 10-Jul | 13-Jul | 17-Jul | 20-Jul | 24-Jul | 27-Jul |
| Sparks, NE | 43.00 -100.20 | 2520 | 18-Jul | 20-Jul | 24-Jul | 27-Jul | 31-Jul | 4-Aug | 7-Aug |
| St Francis, KS | 39.62 -101.82 | 3661 | 10-Jul | 12-Jul | 15-Jul | 19-Jul | 22-Jul | 26-Jul | 29-Jul |
| York, NE | 40.87 -97.63 | 1637 | 5-Jul | 7-Jul | 10-Jul | 14-Jul | 17-Jul | 21-Jul | 24-Jul |
| Washington, KS | 39.77 -97.07 | 1368 | 28-Jun | 30-Jun | 4-Jul | 7-Jul | 11-Jul | 14-Jul | 17-Jul |

Scouting and Management of Western Bean Cutworm
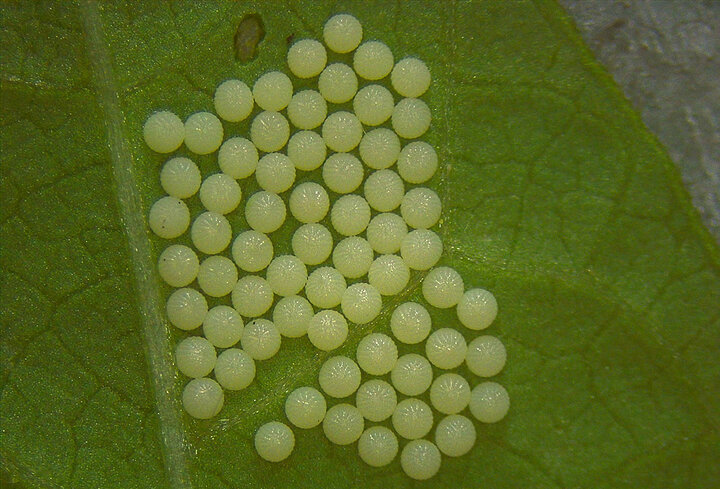
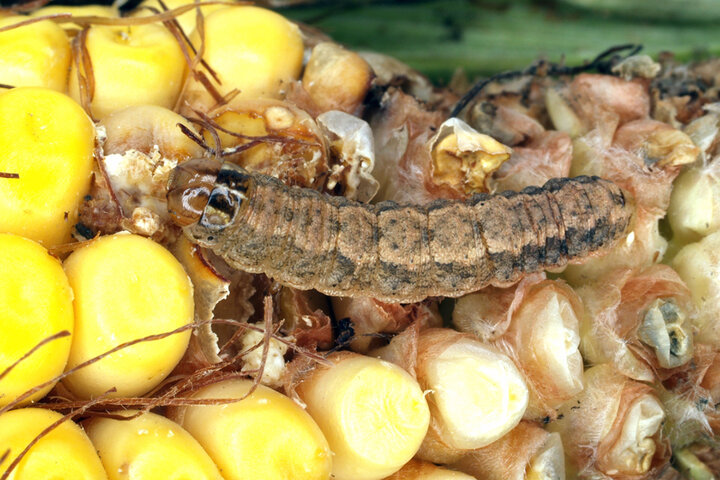
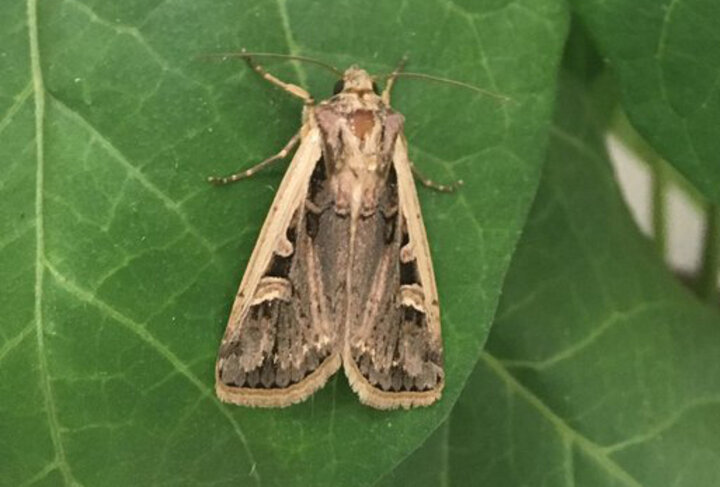
WBC eggs can be found on the upper surfaces of corn leaves, and the lower surfaces of dry bean leaves. Eggs are found in masses ranging from 5-200, with an average of 50-85. When first laid, the eggs will be white and gradually darken during the five- to seven-day development (Figure 2). Freshly hatched larvae will first eat the eggshells before consuming the host plant. Older larvae can be identified by two dark-colored rectangular spots directly behind their head (Figure 3). Adult moths are identifiable by a white band on the anterior margin on the forewing followed by a white circle halfway down the wing and a white crescent located two-thirds down the wing (Figure 4). WBC moths are about three-fourths of an inch long by 1.5 inches wide.


It is more difficult to scout dry bean fields for WBC, but pheromone traps can be used to provide an estimate of a possible infestation and should be installed prior to the predicted 5% flight date. If fewer than 700 moths are caught up to peak, there is low risk; if more than 700 but fewer than 1,000 moths are caught then there is moderate risk; and if there are more than 1,000 moths caught then the risk if high.
| Location | Coordinates | Predicted 25% Flight for 2021 | Actual 25% Flight for 2021 | Difference (Days) |
|---|---|---|---|---|
| Alliance, NE | 42.17 -102.93 | 25-Jul | 25-Jul | 0 |
| Arthur, NE | 41.45 -101.72 | 20-Jul | 22-Jul | 2 |
| Big Springs, NE | 41.15 -102.00 | 17-Jul | 18-Jul | 1 |
| Concord, NE | 42.38 -96.97 | 12-Jul | 14-Jul | 2 |
| Douglas, WY | 42.8 -105.45 | 1-Aug | 1-Aug | 0 |
| Emmet, NE | 42.47 -98.77 | 13-Jul | 15-Jul | 2 |
| Ft. Collins, CO | 40.58 -105.15 | 25-Jul | 25-Jul | 0 |
| Grant, NE | 40.85 -101.72 | 17-Jul | 18-Jul | 1 |
| Holyoke, CO | 40.48 -102.10 | 18-Jul | 19-Jul | 1 |
| Idalia, CO | 39.72 -102.32 | 14-Jul | 16-Jul | 2 |
| Kearney, NE | 40.72 -99.02 | 8-Jul | 9-Jul | 1 |
| Lingle, WY | 42.13 -104.38 | 26-Jul | 25-Jul | -1 |
| Lincoln, NE | 40.72 -96.62 | 3-Jul | 1-Jul | -2 |
| Manhattan, KS | 39.2 -96.6 | 29-Jun | 29-Jun | 0 |
| North Platte, NE | 41.08 -100.78 | 16-Jul | 17-Jul | 1 |
| Scottsbluff, NE | 41.88 -103.68 | 21-Jul | 22-Jul | 1 |
Other Available Resources
- Western bean cutworm speed scouting app for Apple or Android.
- Western bean cutworm spreadsheet.
- Other extension apps on topics ranging from insect control to irrigation management to finance.
- Light trap reports for Clay Center, Mead and North Platte.
