Introduction
Soybean and corn are the most commonly rotated crops in the Midwest, United States. Rotation benefits are well documented for both crops:
- Corn: Average rotational yield benefit = 7.8% increase documented in a literature summary (Erickson, 2008) with a wide range of variation among studies.
- Soybean: Average rotational yield benefit = 8 to 17% by Crookston et al. (1991); 25% by Edwards et al. (1988); approximately 4% by Nafzinger (2007); and 13% for no-till first-year soybean, by Pedersen and Lauer (2002).
Rotation benefits for corn
Potential factors contributing to increased corn yields:
- Improved soil structure (Barber, 1972)
- Decreased disease pressure (Meese et al., 1991)
- Decreased “allelopathy” between corn residue and growing plants. Allelopathy is the detrimental physiological effect (due to production of allelochemical compounds) that corn residue (and other crops) causes to germinating seeds and early growth of plants (Martin et al., 1990)
- Increased nitrogen (N) availability for corn in rotated systems (Stanger and Lauer, 2008)
- Nitrogen availability as the primary driver behind rotation benefits (Gentry et al., 2013)
Rotation benefits for soybean
Potential factor increasing soybean yields:
- Reduced pest pressure from soybean cyst nematode (Dabney et al., 1988)
Literature review
Seifert et al. 2017 collected 748,374 empirical observations of corn and soybean yields from commercial farmer fields in US-Midwest from 2007 to 2012. Their field observations included the states of Nebraska, South Dakota, Minnesota, Iowa, Illinois, and Indiana. With these data, they explored the effect of continuous versus non-continuous - i.e. rotated - corn and soybeans.
Corn results
Reported corn yield penalties are well within the ranges from small-plot research trial literature; however, results were somewhat on the low end (in other words, showing less response to crop rotation than the small-plot data) (Seifert et al. 2017).
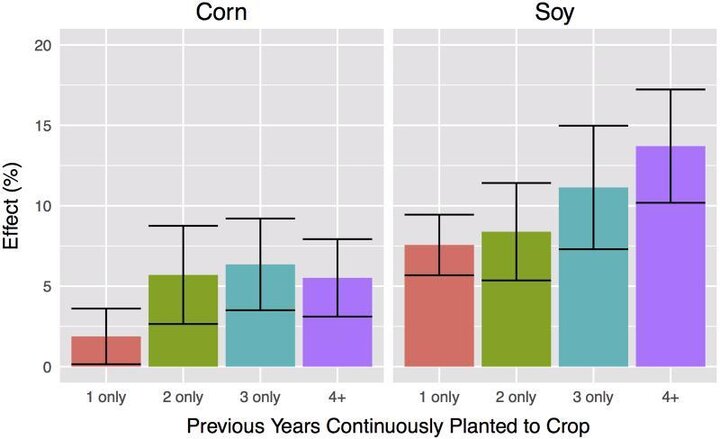
Rotation effects were quite variable and more prominent in dry production areas. Along these lines, if the assumption that less N is supplied to corn in the western corn-belt because of lower yield potentials and thus higher intrinsic risks (Shapiro et al., 2001) is correct, then N availability may be one of the most important factors contributing to continuous corn yield penalties (Gentry et al., 2013). Gentry et al, 2013 found that the yield penalties increased as the number of years continuously cropping corn increased. These yield penalty increases over the years were not found by Seifert et al., 2017 (see Figure 2, left side); this disagreement may be explained with differing corn residue management when comparing results of small-plot trials in one set of comparisons (Gentry et al.) versus results of many commercial fields in the other set of studies (Seifert et al.).
If we go a little more into detailed results, Seifert et al., 2017, also compared irrigated and rainfed fields; yields decreased more with continuous corn in rainfed (4.3%) compared to irrigated environments (1.7%). They concluded that “For corn, western districts had a higher dryland CCYP [continuous corn yield penalty]”. Figure 2 in their paper (access at https://dl.sciencesocieties.org/publications/aj/abstracts/109/2/541?q=publications/aj/abstracts/109/2/541 or reference list) shows that across Nebraska’s and South Dakota’s dryland crop reporting districts (CRD), corn yield penalties were greater than all the other states ranging between 5% and 15%. In addition, their work shows that with the first year corn following corn, yield penalties average about 2% across the six states, while with 2, 3, and 4+ years of continuous corn the average yield penalty was about 5.5% (see Figure 2, left side).

Soybean results
Soybean penalties reported by Seifert et al., 2017 are within the ranges provided by the actual small-plot field trials documented in the literature such as with the Pedersen and Lauer (2002) report. However, those of Seifert et al. are above estimates from Edwards et al. (1988) and below estimates of Nafzinger (2007).
From the Seifert et al. (2017) discussion of the results, diseases are the primary cause of the soybean yield penalties. For example: 1) Greater penalties were seen in cooler, wetter areas. 2) Soybean sudden death syndrome – SDS - thrives in cool, wet conditions (Leandro et al., 2013). 3) Soybean cyst nematode prospers in conditions that would otherwise promote high soybean yields (Niblack, 2005), and the two [SDS and Soybean Cyst Nematode] interact strongly (Westphal, 2008). These results are consistent with evidence that disease pressure is the major cause of the continuous soybean yield penalties. This is also consistent with effects related to disease pressure, given the finding that warmer, drier soils at planting are critical in reducing soybean sudden death syndrome’s development (Scherm, 1996). The accumulation of disease pressure is obvious with continuously higher yield penalties with more years of continuously cropped soybean (see Figure 2, right side).
Digging a bit deeper in the Seifert et al. paper reveals that they compared irrigated to rainfed fields finding that yields decreased more with continuous soybean in rainfed (10.3%) compared to irrigated (9.6%). However, as also they stated, “For soybean, drier districts tended to have less of a penalty, with Nebraska CRDs seeing the lowest coefficients”. Figure 2 in their paper shows that Nebraska’s dryland CRD soybean yield penalties were the least of all the other states ranging below 5%. In addition, their work shows that for first year soybeans following soybeans, yield penalties averaged about 7.5% across the six states. Moreover, with five years of continuous soybean, yield penalties averaged close to 15% (see Figure 2, right side).
Summary
Seifert et al. (2017) summarizes results across “hundreds of thousands” of commercial fields from six Corn Belt states. Their results align well with those results documented in previously reported scientific literature. Both continuous corn and soybean systems have a yield penalty regardless of the experimental setting (from both empirical field observation as well as small-plot field trials). At any rate, these yield penalties are evident as early as the first year for both continuous crops.
Overall highlights
- Continuous corn averaged a 4.3% yield penalty compared to rotated corn.
- Corn yield penalties were greater in areas with low-moisture and low-yields.
- Corn yield penalties increased with up to 3 years of continuous cropping, but not after that - yield penalties stayed similar.
- Continuous soybean averaged a 10.3% yield penalty compared to rotated soybean.
- Soybean yield penalties were greater in low-yield potential years.
- Soybean penalties increased consistently up to 5 years of continuously cropped soybean.
Acknowledgement
Authors would like to thank Keith Glewen, Todd Whitney and Jenny Rees for revising the article and for feedback provided.
References
Barber, S.A. 1972. Relation of weather to the influence of hay crops on subsequent corn yields on a Chalmers silt loam. Agron. J. 64(1):8–10. doi:10.2134/agronj1972.00021962006400010003x
Crookston, R.K., J.E. Kurle, P.J. Copeland, J.H. Ford, and W.E. Lueschen. 1991. Rotational cropping sequence affects yield of corn and soybean. Agron. J. 83(1):108. doi:10.2134/agronj1991.00021962008300010026x
Dabney, S.M., E.C. McGawley, D.J. Boethel, and D.A. Berger. 1988. Short-term crop rotation systems for soybean production. Agron. J. 80(2):197. doi:10.2134/agronj1988.00021962008000020012x
Edwards, J.H., D.L. Thurlow, and J.T. Eason. 1988. Influence of tillage and crop rotation on yields of corn, soybean, and wheat. Agron. J. 80(1):76. doi:10.2134/agronj1988.00021962008000010018x
Erickson, B. 2008. Corn/soybean rotation literature summary. Purdue University, West Lafayette, Indiana.
Gentry, L.F., M.L. Ruffo, and F.E. Below. 2013. Identifying factors controlling the continuous corn yield penalty. Agron. J. 105(2):295. doi:10.2134/agronj2012.0246
Leandro, L.F.S., A.E. Robertson, D.S. Mueller, and X.-B. Yang. 2013. Climatic and environmental trends observed during epidemic and non-epidemic years of soybean sudden death syndrome in Iowa. Plant Health Prog. doi:10.1094/PHP-2013-0529-01-RS
Martin, V.L., E.L. McCoy, and W.A. Dick. 1990. Allelopathy of crop residues influences corn seed germination and early growth. Agron. J. 82(3):555. doi:10.2134/agronj1990.00021962008200030024x
Meese, B.G., P.R. Carter, E.S. Oplinger, and J.W. Pendleton. 1991. Corn/soybean rotation effect as influenced by tillage, nitrogen, and hybrid/cultivar. J. Prod. Agric. 4(1):74–80. doi:10.2134/jpa1991.0074
Nafzinger, E. 2007. What will replace the corn-soybean rotation? Indiana CCA Conference Proceedings, Indianapolis, IN. 18–19 Dec. 2007. Purdue Univ.
Niblack, T.L. 2005. Soybean cyst nematode management reconsidered. Plant Dis. 89(10):1020–1026. doi:10.1094/PD-89-1020
Pedersen, P., and J.G. Lauer. 2002. Influence of rotation sequence on the optimum corn and soybean plant population. Agron. J. 94(5):968–974. doi:10.2134/agronj2002.0968
Scherm, H. 1996. Development of sudden death syndrome of soybean in relation to soil temperature and soil water matric potential. Phytopathology 86(6):642. doi:10.1094/Phyto-86-642
Seifert, C.A., M.J. Roberts, and D.B. Lobell. 2017. Continuous Corn and Soybean Yield Penalties across Hundreds of Thousands of Fields. In Crop Economics, Production & Management. Agron. J. 109:541–548 (2017). doi:10.2134/agronj2016.03.0134 Available at (main paper cited in this report): https://dl.sciencesocieties.org/publications/aj/abstracts/109/2/541?q=publications/aj/abstracts/109/2/541
Shapiro, C.A., R.B. Ferguson, G.W. Hergert, A. Dobermann, and C.S. Wortmann. 2001. Fertilizer suggestions for corn. NebGuide G74-174 A. Univ. of Nebraska, Lincoln.
Stanger, T.F., and J.G. Lauer. 2008. Corn grain yield response to crop rotation and nitrogen over 35 years. Agron. J. 100(3):643–650. doi:10.2134/agronj2007.0280
Westphal. 2008. Sudden death syndrome. The Plant Health Instructor. doi:10.1094/PHI-I-2008-0102-01

