PART 1 – Irrigated soybean: planting date, row spacing, seeding rate and nitrogen management
Continuous corn is the most common irrigated crop sequence in southwest Nebraska. Although rotating to other crops, such as soybeans, can mitigate some production issues of continuous corn and often boost the next year’s corn yield, larger adoption of soybean has not readily occurred in this area. According to USDA Farm Service Agency planted acreage data, on average southwest Nebraska farmers plant irrigated soybean every fifth year.
The culture of farming in southwest Nebraska evolves around corn, which often prevents growers from raising soybeans under more ideal conditions. For example, priority is often given to planting corn first, soybeans are planted strip-till in 30-inch rows, and seeding rates of 160,000 seeds/ac are common. In addition, late season chemigation with nitrogen (N) is widespread without a full understanding of when and where it’s warranted (Stepanovic et al., 2018a)
The objective of this study was to investigate the impact of planting date, row spacing, seeding rates, and N management on yield and yield components of irrigated soybean in southwest Nebraska.
Characteristics of the Two Research Sites
The study was conducted at two locations in Perkins County (the Kemling and Stumpf farms) in 2018. The predominant soil type at the Kemling Farm was Rosebud loam; at the Stumpf farm it was Kuma silt loam. At the Kemling Farm, the whole field was disked prior to planting; at the Stumpf farm, soybeans were seeded no-till. At both locations the previous crop was corn. Besides study treatments, soybeans were grown following UNL agronomic and irrigation recommendations.
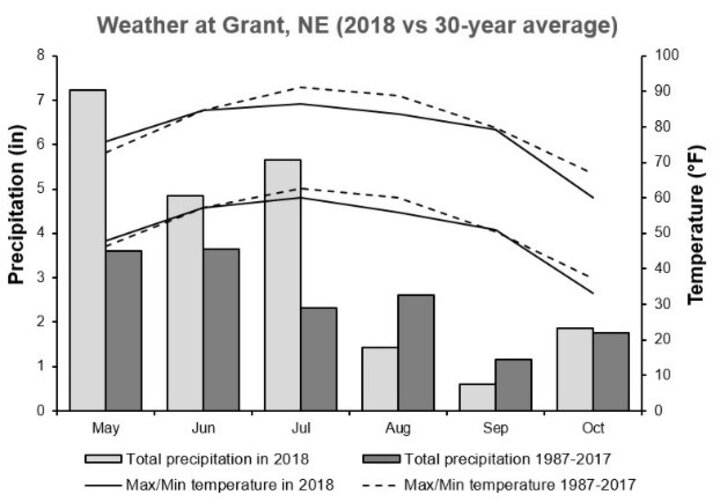
The 2018 seasonal precipitation (May-Oct) was 6.5 inches higher than the 30-year average, especially early in the season (Figure 1), leading to issues with crusting and soybean germination. In addition, two hail events occurred at both sites. The first hail event occurred May 25, causing stand reduction in early planted soybeans. The second hail event occurred in mid-August, causing 20% hail injury at the Stumpf Farm and 5% at the Kemling Farm.
Grain Yield Results
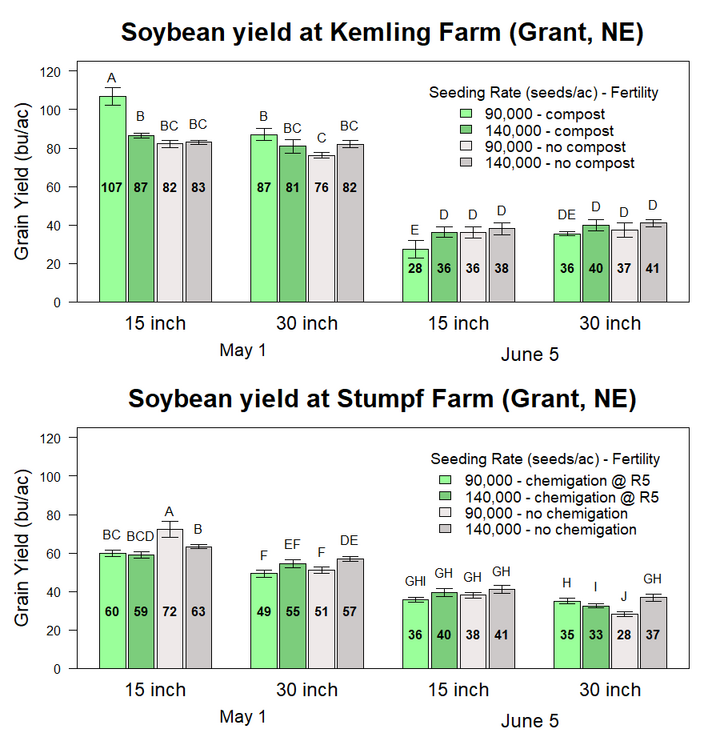
Overall, grain yield was lower at the Stumpf Farm compared to the Kemling Farm, mostly due to greater impact of soil compaction and hail injury. A cool wet spring in combination with direct seeding (no-till) of soybean at the Stumpf farm caused issues with sidewall compaction, soil crusting, and early season growth and development. Disked soil at the Kemling Farm dried out quicker, creating better seeding conditions, less sidewall compaction, and consequently fewer issues with crusting and early season plant growth (Jasa, 2010).
At both locations the best soybean yields were observed at the early planting date (May 1) and in narrower row spacing (15 inches), while higher seeding rates did not have any measurable yield increase regardless of location and practices used.
At the Kemling Farm, early planted soybeans benefited from pre-plant application of compost at 5 ton/ac, yielding as much as 107 bu/ac. This trend, however, was not observed at late planting dates as yields dropped to 28-41 bu/ac. At the Stumpf Farm, chemigation of 50 lbs of N/ac at R5 (beginning seed) did not result in a yield increase.
What are Soybean Yield Components and Why do They Matter?
Grain yield is comprised of several components that, when analyzed separately, can allow us to better understand their individual contribution to overall grain yield. Despite differences in grain yield, the relationship between grain yield and yield components was similar at the two sites. Table 1 summarizes correlation coefficients averaged across sites. The sign of correlation coefficient (r) indicates the nature of the relationship (either positive or negative) while the magnitude of coefficient (ranging from 0 to 1) represents the strength of the linear relationship.
Correlation between grain yield and plants/ac, seeds/pod, and seed weight was not significant (Table 1), suggesting that:
- changes of plant population had no impact on grain yield, and
- differences observed in grain yield had no impact on seeds/pod and/or seed weight.
| Terms | Grain yield (bu/ac) | Planting date | Plants/acre | Nodes/plant | Branches/plant | Pods/plant | Seeds/pod |
|---|---|---|---|---|---|---|---|
| Planting date | -0.83* | ||||||
| Plants/acre | -0.01 | 0.32* | |||||
| Nodes/plant | 0.58* | -0.58* | -0.28* | ||||
| Branches/plant | 0.50* | -0.52* | -0.30* | 0.41* | |||
| Pods/plant | 0.42* | -0.62* | -0.62* | 0.54* | 0.61* | ||
| Seeds/pod | -0.14 | 0.21 | 0.07 | 0.04 | 0 | -0.30* | |
| Seed weight | 0.19 | -0.1 | 0.02 | 0.09 | 0.28 | 0.14 | 0.14 |
* Correlation coefficient significant at 5% level. The sign of coefficient indicates the nature of relationship (either positive + or negative -) while the magnitude of coefficient (ranging from 0 to 1) represents the strength of the linear relationship.
Why Planting Date Matters
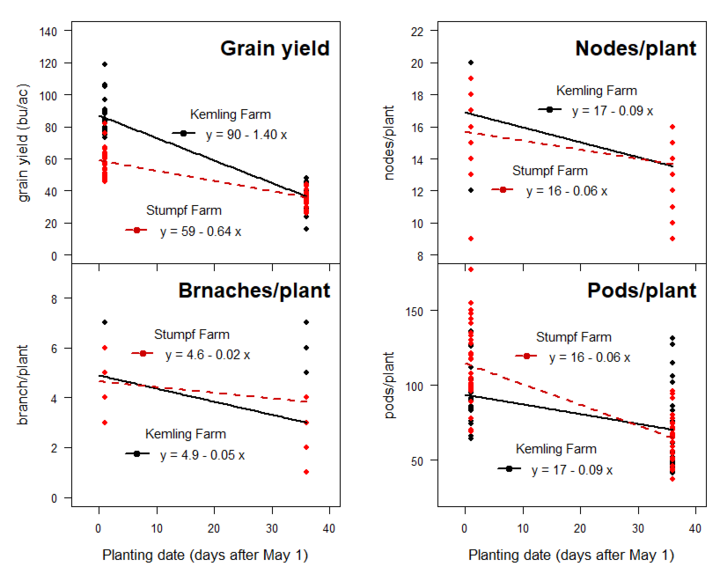
Previous UNL research on soybean in eastern Nebraska has demonstrated that for each day that soybean planting is delayed after May 1, yield penalties of 0.25-0.63 bu/ac can occur, depending on the year. (Elmore et al., 2014; Specht et al., 2012.) In our one-year study in southwest Nebraska, we found much larger daily yield penalties of 1.40 bu/ac/day at the Kemling Farm and 0.64 bu/ac/day at the Stumpf Farm (Figure 3).
Among yield components, nodes/plant, branches/plant and pods/plant were all negatively correlated with planting date (Table 1) suggesting that each soybean plant produced less nodes, branches and pods as planting date was delayed (Figure 3).
Why Row Spacing Matters
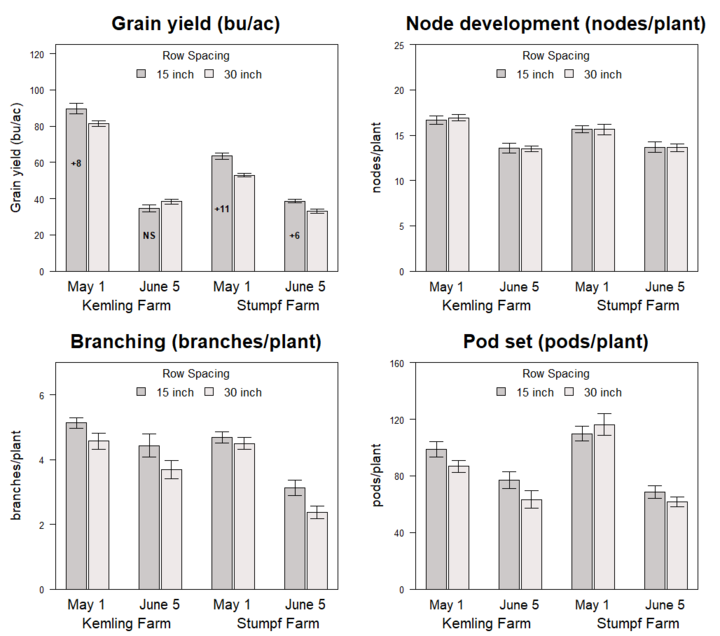
Overall, soybeans yielded better when planted in narrower rows. At the Kemling Farm a yield advantage of 8 bu/ac was observed with 15-inch rows at early planting, while there was no yield advantage with narrower rows at late planting date (Figure 4). At the Stumpf Farm, there was a yield advantage of 11 and 6 bu/ac with narrower rows at early and late planting, respectively. This is largely in agreement with our previous on-farm research studies that showed 3-13 bu/ac increases with 15-inch as compared to 30-inch rows (Stepanovic et al., 2018b).
Narrower seeding did not influence soybean node development; however, we did observe enhanced branching and consequently a greater number of pods per plant. The additional pods located on the side branches contributed greatly to the yield increase in narrower rows (data not show).
Why Seeding Rate Matters Less than Other Factors
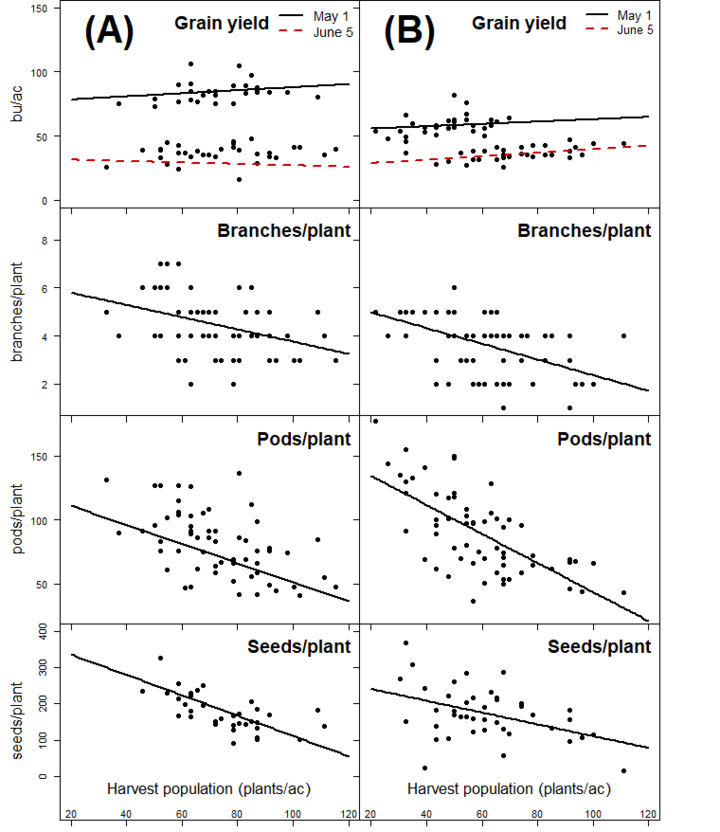
Soybean yield at both the Kemling and Stumpf farms did not respond to changes in plant populations. Although soybeans were seeded at 90,000 and 140,000 live seeds/ac, actual harvest population (plants/ac) ranged between 30,000 and 120,000 plants/ac at the Kemling Farm and between 20,000 and 110,000 plants/ac at the Stumpf Farm. The stand reduction at both sites was due to early season crusting issues and hail injury.
Lack of soybean yield response to increasing populations may be explained by increased competition among the soybean plants themselves. Increasing plant population causes individual soybean plants to produce fewer branches, pods, and seeds, and consequently less yield (Figure 5).
It’s All About Being More Profitable
In summary, soybean yield potential is increased when the crop is seeded earlier (0.64-1.40 bu/ac/day) and in narrower rows (up to 11 bu/ac yield advantage). This yield potential was achievable at lower seeding rates and without late season N supplementation.
It is not uncommon in western Nebraska to see soybean seeding delayed until after irrigated corn is planted, and to do it in 30-inch rows and at 160,000 seeds/ac. Assuming that yield penalties for late planting are lower for corn than for soybean, that typically there are fewer soybean acres to plant, and that market prices of soybean ($8.00/bu) are higher than corn ($3.30/bu), we outline potential savings from incorporating the following practices:
- Seeding soybeans 10 days earlier than as traditional and before corn – $48 to $112/ac;
- Seeding soybean in 15-inch rather than 30-inch rows with modest 3 bu/ac yield increase – $24/ac;
- Reducing seeding rates from 160,000 to 120,000 seeds/acre – $15/ac; and
- Eliminating late season chemigation with 50 lbs of N/ac – $20/ac.
Among these four production factors, early planting is the one factor that soybean growers in the region most often overlook and therefore lose the opportunity to increase their profit margins substantially. Therefore, the real question is what should we plant first in southwest Nebraska: corn or soybeans? The answer is: soybeans.
The real question is what should we plant first to achieve optimal profitability in southwest Nebraska: corn or soybeans?
The answer is soybeans.
We can look to Iowa State University research for supporting data (Klein, 2009). Corn planted between April 20 and May 5 achieved 100% yield potential. Depending on year-to-year variability 99% of yield potential could still be achieved with corn planted before May 20. In the three-year study, significant yield reductions occurred only once and that was when corn planting dates were extended to late May or June. In southwest Nebraska research in 2018, we observed daily yield penalties of 0.5-1.0 bu/ac/day for corn planted after May 1 (Stepanovic, 2018; one year data).
We strongly recommend soybean farmers in western Nebraska evaluate their seeding and fertility practices and consider implementing changes that could lead to a more profitable crop.
Acknowledgements
I would like to thank my interns Nemanja Arsenijevic and Zaim Ugljic as well as our part-time technician Justin Richardson for their hard work on this project. We also thank Jim and Troy Kemling who allowed us to do this research on their farm. Lastly, we thank the Nebraska Soybean Board. Without their financial support, this project would not have been possible.
References
Stepanovic Strahinja, Arsenijevic Nemanja, Ugljic Zaim. 2018a. Is Late Season N Fertilization Warranted for Irrigated Soybean in Western Nebraska? Nebraska Extension Crop Watch, link: https://cropwatch.unl.edu/2018/late-season-n-soybeans
Stepanovic Strahinja, Thompson L., Glewen K. 2018b. How Row Spacng Affects Irrigated Soybean in Southwest Nebraska. Nebraska Extension Crop Watch, link: https://cropwatch.unl.edu/2018/how-row-spacng-affects-irrigated-soybean-southwest-nebraska
Stepanovic Strahinja. 2018c. Impact of Hybrid Selection, Planting Date, and Seeding Rates on Dryland Corn in Western Nebraska. Nebraska Extension Crop Watch, link: https://cropwatch.unl.edu/2018/dryland-corn-western-nebraska
Jasa Paul. 2010. Recommendations for Avoiding Sidewall Compaction at Planting. Nebraska Extension Crop Watch, link: https://cropwatch.unl.edu/unl-cropwatch-april-16-2010-recommendations-avoiding-sidewall-compaction-planting
Elmore Roger, Specht J., Rees J., Grassini P., Glewen K. 2014. Why Planting Soybean Early Improves Yield Potential. Nebraska Extension Crop Watch, link: https://cropwatch.unl.edu/why-planting-soybean-early-improves-yield-potential
Specht Jim, Rees J., Zoubek G., Glewen K., VanDeWalle B., Schneider J., Varner D., Vyhnalek A.. 2012. Soybean Planting Date – When and Why. Nebraska Extension Cicrular EC145, link: http://extensionpublications.unl.edu/assets/pdf/ec145.pdf
Klein Bob. 2009. How Corn Planting Date Can Affect Yield. Nebraska Extension Crop Watch, link: https://cropwatch.unl.edu/how-corn-planting-date-can-affect-yield
PART 2 – Dryland Corn: hybrid selection, planting date and seeding rates
Corn is a critical part of dryland crop rotations in western Nebraska and is typically grown either as continuous corn or after winter wheat in a three-year winter wheat-corn-fallow rotation. Many farmers prioritize planting irrigated acres first, often delaying planting dryland corn until after the USDA Risk Management Agency’s final planting date (May 25) for full insurance coverage.
The May 25 planting cutoff is applied across Nebraska. Many corn growers in western Nebraska perceive this policy as unfair due to the shorter growing season and often better grain yield observed in late-planted corn. During the 2017 early season drought, many farmers in Chase County lost their early-planted dryland corn (Figure 1). Others in the region reported better yield of late-planted dryland corn.
In response, this two-year study was designed to evaluate the effects of planting dates on dryland corn and examine whether hybrid selection and seeding rate recommendations might change as planting dates are delayed.

On-farm strip trial at Stumpf farm, Grant, Nebraska
A strip trial was conducted at the Henry J. Stumpf International Wheat Center at Grant during the 2018 and 2019 growing season on a 75-acre field. The predominant soil type at the site was Kuma silt loam. The trial was managed using UNL no-till practices and a fertility program based on 150 bu/ac yield goal. In 2018, previous crop was corn, while in 2019 previous crop was winter wheat.
Four seed corn companies provide their best performing dryland corn hybrids:
- Dekalb DKC51-20RIB (101 day)
- Croplan 4079SS (100 day)
- Golden Harvest G03C84-5122-EZ1 (103 day)
- Pioneer P0589AMXT (105 day)
Four hybrids were planted at five planting dates:
- 2018 – May 1, May 10, May 20, May 30, June 10
- 2019 – May 4, May 10, May 16, May 31, June 6
Within planting date blocks hybrids were planted at five seeding rates: 7, 11, 15, 19, and 23 thousand seeds/ac. Each hybrid by planting date by seeding rate combination was replicated three times and planted into 60 ft x 150 ft strips. The middle 12 rows (30 ft) of each strip was harvested for yield.
Better yield with early planting
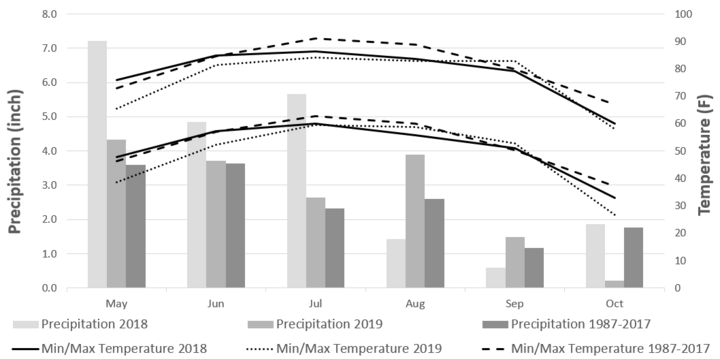
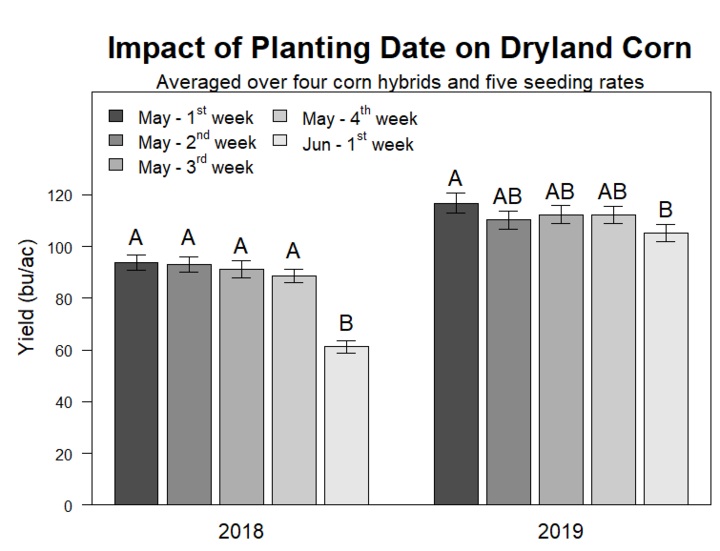
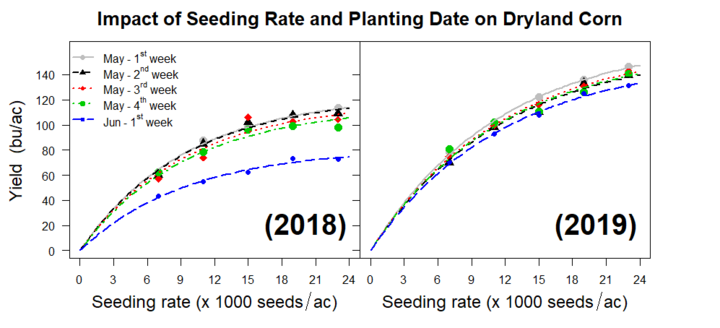
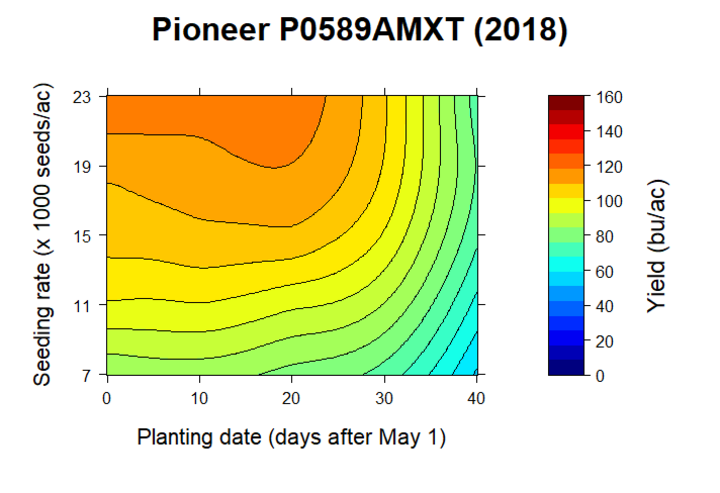
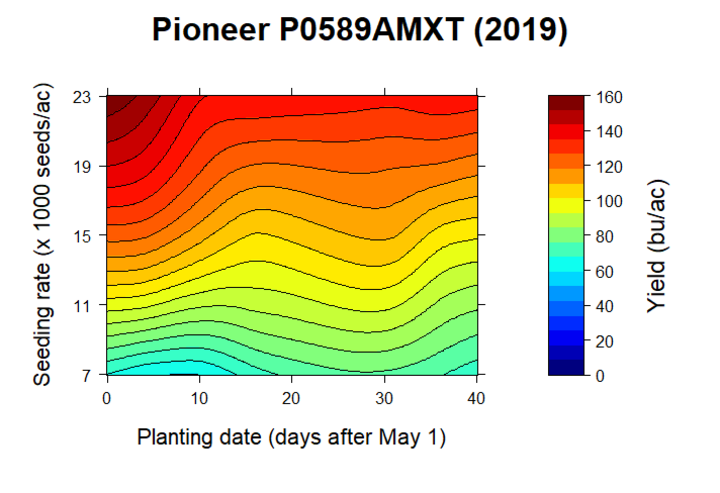
Early planted corn yielded better regardless of the hybrid and seeding rate (Figure 3, Table 1 and 2). The yield penalties for May planted corn, however, were much lower in 2019 due to above average precipitation in August and September (Figure 2). For example, yield penalties for late planting ranged from 0.5-1.0 bu/ac/day in 2018 and were only 0.2-0.4 bu/ac/day in 2019 growing season (Figure 3, Table 1 and 2).
Planting in June caused sharper decline in grain yield. Between May 31st and June 10th yield decreased 18-24 bu/ac in 2018 and 8-10 bu/ac in 2019 (Table 1 and 2). Higher yield penalty in 2018 is likely associated with below average rain in August and September (Figure 2).
Yield penalties for planting after May 25 (cutoff date for full insurance coverage) and before May 31 ranged 0-5 bu/ac in 2018 and 0-2 bu/ac in 2019, depending on the seeding rate (Table 1 and 2).
| Seeding rate (sseds/ac) | Planting Date | ||||||||
|---|---|---|---|---|---|---|---|---|---|
| 1-May | 6-May | 11-May | 16-May | 21-May | 26-May | 31-May | 5-Jun | 10-Jun | |
| 23,000 | 114 | 113 | 110 | 109 | 106 | 104 | 99 | 88 | 75 |
| 21,000 | 111 | 110 | 109 | 107 | 105 | 104 | 99 | 87 | 73 |
| 19,000 | 107 | 108 | 107 | 106 | 105 | 103 | 98 | 86 | 71 |
| 17,000 | 103 | 104 | 105 | 103 | 103 | 101 | 97 | 84 | 68 |
| 15,000 | 98 | 99 | 100 | 98 | 99 | 97 | 93 | 80 | 64 |
| 13,000 | 92 | 92 | 93 | 91 | 90 | 90 | 87 | 75 | 60 |
| 11,000 | 84 | 84 | 84 | 81 | 79 | 81 | 79 | 69 | 55 |
| 9,000 | 74 | 74 | 73 | 71 | 69 | 71 | 71 | 62 | 49 |
| 7,000 | 63 | 63 | 62 | 60 | 59 | 62 | 62 | 54 | 43 |
| Seeding rate (sseds/ac) | Planting Date | ||||||||
|---|---|---|---|---|---|---|---|---|---|
| 1-May | 6-May | 11-May | 16-May | 21-May | 26-May | 31-May | 5-Jun | 10-Jun | |
| 23,000 | 150 | 147 | 144 | 144 | 144 | 143 | 140 | 136 | 132 |
| 21,000 | 143 | 140 | 137 | 137 | 137 | 136 | 134 | 130 | 125 |
| 19,000 | 136 | 133 | 131 | 130 | 130 | 129 | 127 | 123 | 118 |
| 17,000 | 128 | 126 | 123 | 123 | 123 | 122 | 120 | 116 | 111 |
| 15,000 | 120 | 118 | 114 | 114 | 115 | 115 | 113 | 109 | 104 |
| 13,000 | 111 | 109 | 106 | 106 | 107 | 107 | 106 | 101 | 96 |
| 11,000 | 102 | 99 | 96 | 96 | 98 | 99 | 98 | 93 | 87 |
| 9,000 | 92 | 89 | 86 | 87 | 88 | 90 | 89 | 84 | 79 |
| 7,000 | 82 | 79 | 76 | 76 | 79 | 80 | 80 | 75 | 70 |
Good response to higher seeding rates
The optimal seeding rate is the one that provides the best return (yield/profit) on the investment (seed/seed price). Thus, increasing seeding rates beyond point of maximum net return will result in economic losses. This point changes depending on the environment (i.e. yield goal) and is usually observed at the seeding rate where corn yield starts to plateau.
Assuming price of seed corn to be $280 per bag (80,000 seeds) and $3.50 ($3.85-$0.35 for harvest and hauling)/bu price of corn grain on the market, increasing seeding rate by 2,000 seeds/ac costs $7/ac and needs to provide > 2 bu/ac yield increase to be economically justified.
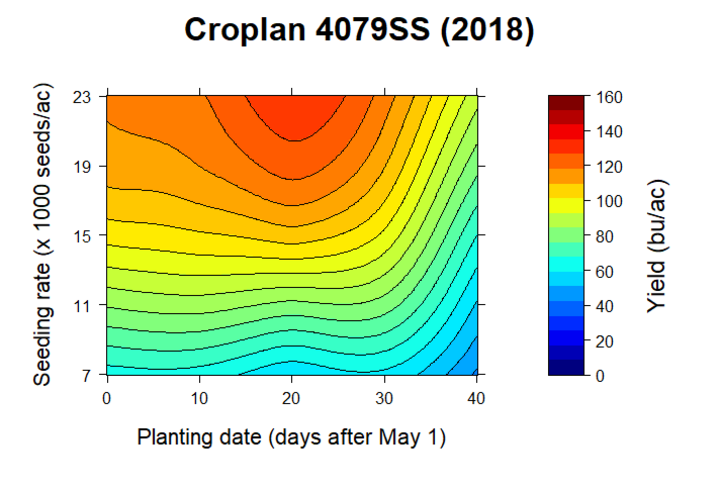
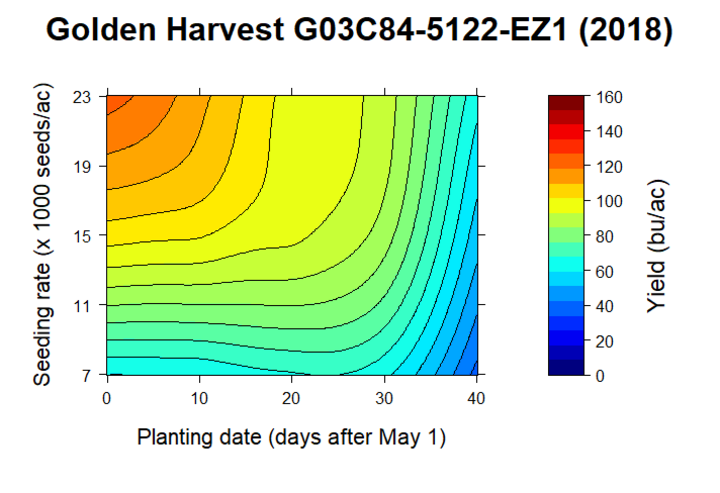
In 2018, corn responded well to high seeding rates (>17,000 seeds/ac), especially at early-planting dates (early-mid May) while increasing seeding rate beyond 17,000 seeds/ac was seldom economically justified at late planting dates (Figure 4, Table 1 and 2).
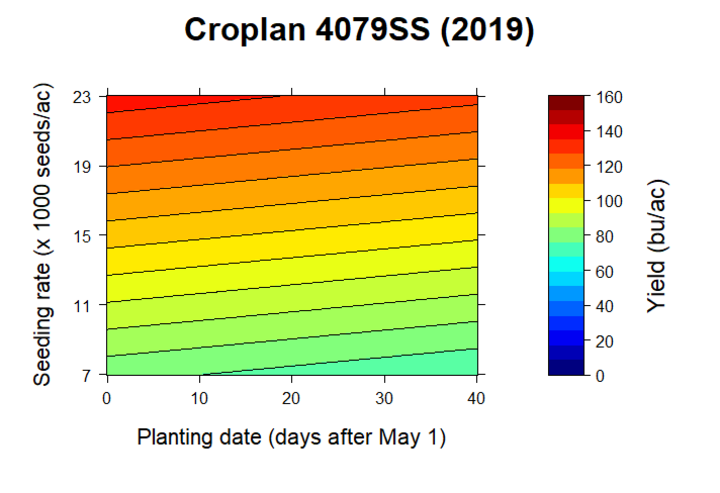
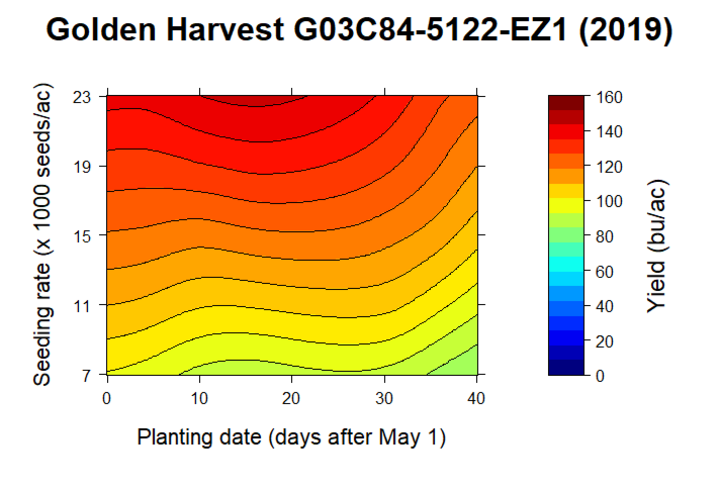
In 2019, yield increased 6-10 bu/ac for each additional 2,000 seeds/ac regardless of the planting date suggesting that economically optimal seeding rates was beyond the highest seeding rate evaluated (23,000 seeds/ac).
Hybrid-specific responses
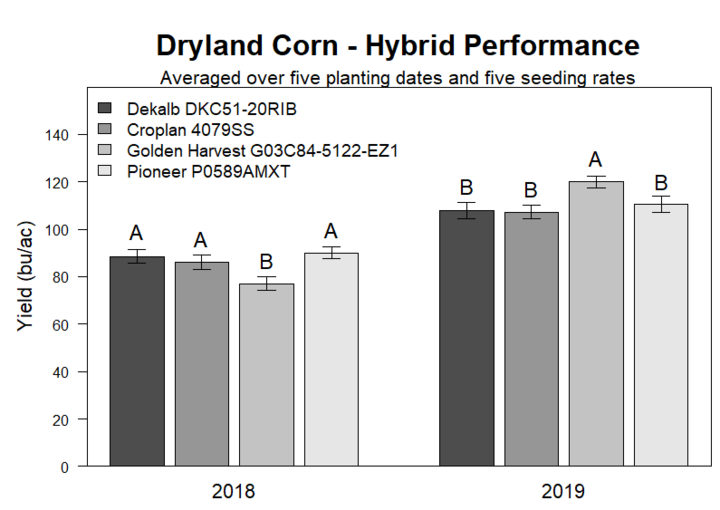
Dekalb, Croplan and Pioneer hybrids had similar overall yield in both 2018 and 2019, while Golden Harvest under-performed in 2018 and over-performed in 2019 compared to the other three (Figure 5).
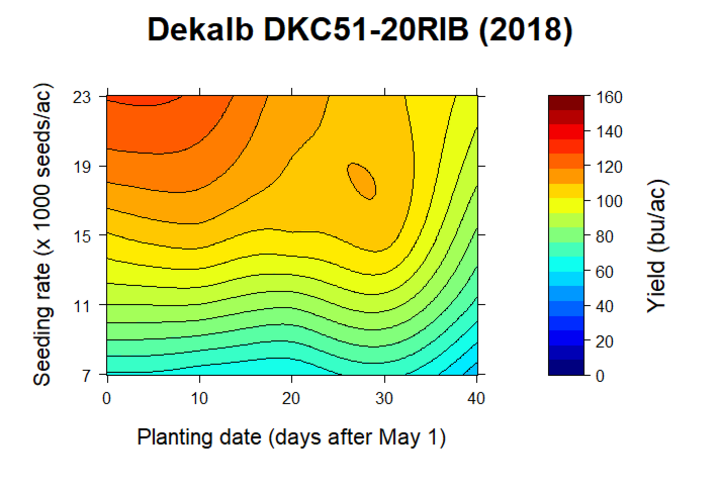
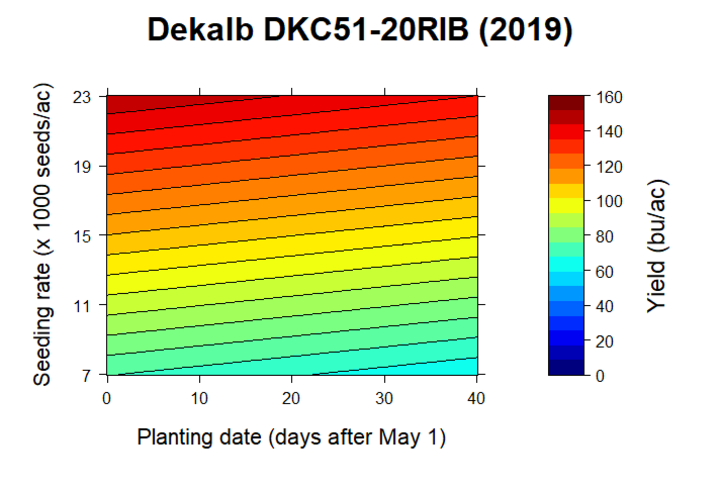
Corn hybrid rankings, however, changed depending on planting date and seeding rate (Figure 6, Table 3 and 4). In 2018, Croplan performed the best when planted in mid-May planting and seeding rates >15,000 seeds/ac; the Dekalb had the best yield when planted in early-May at high seeding rates (>15,000 seeds/ac) and when planted in June; the Pioneer hybrid yielded the best at when planted at low seeding rates
Take home messages
Our data strongly supports earlier planting in dryland corn. Fairness of RMA policy towards western Nebraska farmers, however, is subject to debate. In both 2018 and 2019 growing seasons small yield penalties occurred between May 25 (the cutoff date for full crop insurance) and May 31, while sharp decline in yield was observed when corn was planted in June, especially in 2018 when precipitation in August and September was below average.
There was strong response to seeding rates higher than currently recommended 15,000 seeds/ac. Previous modeling studies by Nebraska Extension Specialists Bob Klein and Drew Lyon showed that a harvest population of 12,500 plants per acre provided the best economic returns in dryland corn production in western Nebraska. We are reluctant to recommend increasing seeding rates > 15,000 seeds/ac as both 2018 and 2019 growing season had above average precipitation. In semi-arid regions impacted by intermittent periods of drought, such as in western Nebraska, evaluating response of dryland corn to seeding rates in a drier year would be a necessity.
Hybrid selection showed once again to be one of the most important decisions in dryland corn production. However, better understanding of hybrid-specific responses to planting dates and seeding rates can cause large yield difference. Multi-year evaluation would be beneficial to better understand the climate variables that make one hybrid yield better than the other.
| Seeding rate (sseds/ac) | Planting Date | ||||||||
|---|---|---|---|---|---|---|---|---|---|
| 1-May | 6-May | 11-May | 16-May | 21-May | 26-May | 31-May | 5-Jun | 10-Jun | |
| 23,000 | D | D | D | C | C | C | C | C | D |
| 21,000 | D | D | D | C | C | C | C | D | D |
| 19,000 | D | D | D | C | C | C | C | D | D |
| 17,000 | D | D | D | C | C | C | D | D | D |
| 15,000 | P | P | P | P | P | D | D | D | D |
| 13,000 | P | P | P | P | P | P | D | D | D |
| 11,000 | P | P | P | P | P | P | D | D | D |
| 9,000 | P | P | P | P | P | P | P | D | D |
| 7,000 | P | P | P | P | P | P | P | P | P |
| Seeding rate (sseds/ac) | Planting Date | ||||||||
|---|---|---|---|---|---|---|---|---|---|
| 1-May | 6-May | 11-May | 16-May | 21-May | 26-May | 31-May | 5-Jun | 10-Jun | |
| 23,000 | P | P | D | GH | GH | D | D | D | D |
| 21,000 | P | P | GH | GH | GH | GH | GH | D | D |
| 19,000 | P | P | GH | GH | GH | GH | GH | GH | D |
| 17,000 | P | P | GH | GH | GH | GH | GH | GH | GH |
| 15,000 | P | P | GH | GH | GH | GH | GH | GH | GH |
| 13,000 | GH | GH | GH | GH | GH | GH | GH | GH | GH |
| 11,000 | GH | GH | GH | GH | GH | GH | GH | GH | GH |
| 9,000 | GH | GH | GH | GH | GH | GH | GH | GH | GH |
| 7,000 | GH | GH | GH | GH | GH | GH | GH | GH | GH |
