Spring wheat is a cool season cereal crop grown mostly in the northern parts of the US where cooler summers allow the crop to avoid heat stress and have extended grain filling period. As wheat production moves further south, climate conditions change towards milder winters and hotter summer, favoring production of winter wheat. In Nebraska, almost all wheat production comes from winter wheat.
Why Spring Wheat Did Not Work in the Past
The past attempts to incorporate spring wheat into a dryland cropping system of semiarid western Nebraska often failed due to:
- Grain yield being approximately 40-60% lower than that of winter wheat.
- Lack of infrastructure such as availability of seed, storage, crop insurance, and marketing opportunities.
- Favorable market prices for other crops commonly used in crop rotations (i.e. corn and winter wheat).
- High efficiency of fallow period in terms of lower cash rent and herbicide expenses.
Why Spring Wheat Might Work Now
Over the past several years, gradual decline in both corn and winter wheat prices, increased difficulties of efficiently controlling weeds during the fallow period, and penalties associated with low protein in winter wheat forced many farmers to abandon traditional wheat-corn-fallow rotation and attempt to meet financial goals by adopting a continuous crop rotation. Based on our most recent survey, most farmers decide to either grow continuous corn or replace fallow with an alternative crop (e.g. field peas, proso millet, soybeans, etc.) and grow it in three-year rotation with wheat and corn.
In a semiarid climate, such as western Nebraska, intensifying crop rotations will inevitably lead to reduction in yield of the subsequent crop in rotation. In case of continuous corn, yield penalties are also a consequence of gradual decline in residue cover and increase in weed, insect, and disease pressure that require additional management expenses. Many farmers view spring wheat as rotational crop with a purpose to break the weed and pest cycles, build up the residue cover, and increase yield of corn the following years. It is unlikely that spring wheat will generate high profits, but if farmers are able to break even at the expense of increasing corn yield the following 3-4 years, spring wheat has a good chance of being successfully implemented into a dryland crop rotation of western Nebraska.
Helping Farmers Grow and Market Spring Wheat
In the spring of 2020, Nebraska Extension initiated the research on spring wheat to generate baseline information on variety performance and optimal agronomic practices that would help farmers successfully grow the crop. Besides yield, the objective of this research was to determine the impact of variety selection, fertility programs, and tillage on grain protein content as well as baking and milling qualities of spring wheat. Such information would allow farmers to adopt strategies that yield a more marketable product with easier access to niche markets.
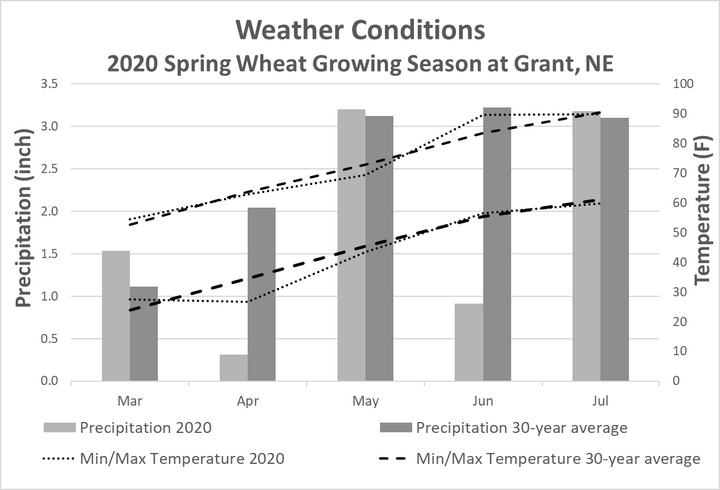
The study was conducted at Henry J. Stumpf International Wheat Center near Grant, NE. Several breading companies (both public and private) were contacted to provide the varieties they believe would perform well in our environment. The soil type at the research site was Kuma silt loam with soil pH of 5.3, organic matter content of 1.9%, preplant soil P (0-8 in) 79 ppm, and preplant soil N (0-24 in 19 lbs/ac). The previous crop was corn that had 120 bu/ac in 2019. The growing conditions were hotter and dryer than normal, with seasonal precipitation (Mar-Jul) lower than 30-year average by 3.5 inches (Figure 2).

Field Trial Treatments – Varieties, Tillage, and Nitrogen
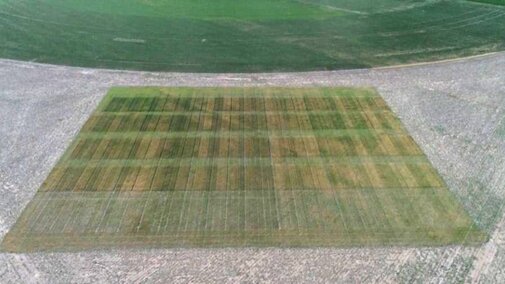
Total of 19 spring wheat varieties were planted on Mar 6 in three tillage blocks (no-till, vertical till, and conventional till) at the seeding rate of 1.5 million live seeds/ac. Tillage treatments were performed prior to planting (Mar 2); vertical tillage chopped the residue leaving most of the it on the ground surface, while conventional tillage incorporated plant residue into the ground. On Mar 27, at tillering stage five nitrogen (N) rates (0, 50, 100, 150, and 200 lbs of N/ac) in a form of liquid urea ammonium nitrate (32-0-0) were applied across all varieties and tillage blocks using fertilizer nozzles on the commercial sprayer. The field received 0.51 inches of rain shortly after fertilizer application incorporating applied fertilizer into a soil.
Variety Performance
Variety yield performance (i.e. yield ranking) apeared not to be affected by different tillage and N management practises. These results suggest that verieies that performed well under no-till or low N also performed well under vertical tillage or high N and vice versa. Combined over all tillage and N rates, yield of spring wheat varieties ranged from 12.0 to 20.2 bu/ac averaging 16.8 bu/ac (Table 1).
Among the varieties evaluated, WestBred’s hard red WB-9590 performed the best yielding 20.2 bu/ac, which was 42% of the yield obtained in a neighbouring field of winter wheat (47 bu/ac) planted after a fallow year (Table 1). WestBred also had a hard white variety, WB-7202CLP, that yielded 18.7 bu/ac and was ranked 3rd in the overall performance (Table 1). Montana State, Minnesota Crop Improvement Association, AgriPro (Syngenta), and South Dakota State University (SDSU) each had at least one variety in the upper half of the overall yield rankings, while all North Dakota State University (NDSU) varieties were in the bottom half (Table 1).
Table 1| Company | Variety | Yield (bu/ac) | Rank |
|---|---|---|---|
| WestBred (Bayer) | WB 9590 HRS | 20.2 | 1 |
| WestBred (Bayer) | WB 9719 HRS | 18.8 | 2 |
| WestBred (Bayer) | WB 7202 CLP HWS | 18.7 | 3 |
| Montana State | Vida | 18.5 | 4 |
| WestBred (Bayer) | WB 9606 HRS | 18.2 | 5 |
| Minnesota Crop Improvement Association (MNCIA) | MN Torgy | 18 | 6 |
| AgriPro (Syngenta) | SY Rustler | 17.7 | 7 |
| WestBred (Bayer) | WB 7696 HWS | 17.1 | 8 |
| South Dakota State University (SDSU) | Surpass | 17 | 9 |
| WestBred (Bayer) | WB 9479 HRS | 16.8 | 10 |
| South Dakota State University | Prevail | 16.8 | 11 |
| North Dakota State University (NDSU) | Glenn HRS | 16.3 | 12 |
| Minnesota Crop Improvement Association | MN Lang | 16.3 | 13 |
| North Dakota State University (NDSU) | ND Vitpro HRS | 16.1 | 14 |
| North Dakota State University (NDSU) | Faller HRS | 16 | 15 |
| South Dakota State University (SDSU) | Boost | 15.5 | 16 |
| AgriPro (Syngenta) | SY Valda | 15.3 | 17 |
| AgriPro (Syngenta) | SY Ingmar | 14.6 | 18 |
| North Dakota State University (NDSU) | ND Frohberg HRS | 12 | 19 |
| Plot average | 16.8 | ||
| Yield difference at 5 % level | 4.7 |
Tillage and Nitrogen Management
Spring wheat yield response to tillage was slightly better (~2-3 bu/ac) at low N rates (

Economically Optimal N Rate
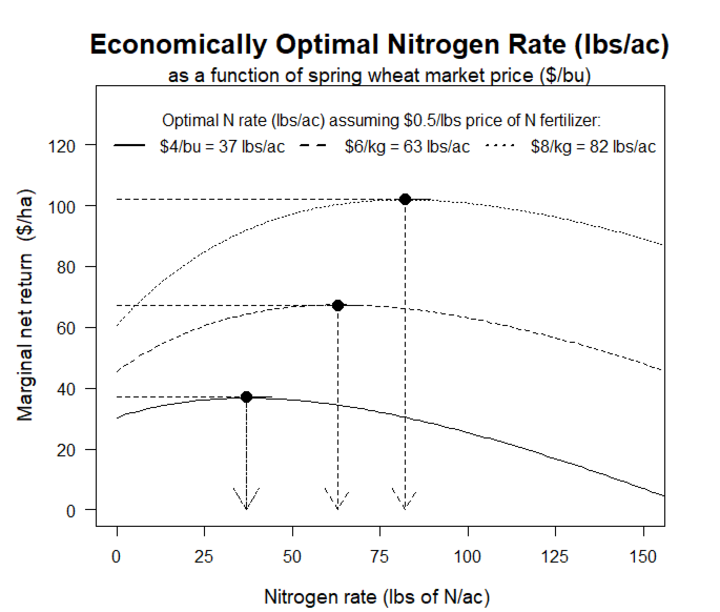
From the economical standpoint, gain in yield for each additional unit of N fertilizer can only be justified if the economic returns (i.e. yield x grain price) exceed the investement (i.e. N rate x price of fertilizer). In 2020, hot and dry weather coditions that did not favor growth and development of spring wheat (Figure 2); consequently, yield potential was reduced and spring wheat was not very responsive to higher N rates (Figure 3).
Based on curent price of spring wheat ($5/bu) and N fertilizer ($0.50/lb of N) the optimal N fertilizer rate for spring wheat during the 2020 growing season at Grant, NE was 51 lbs of N/ac, which coresponded to 15 bu/ac yield (Table 2). While spring wheat yielded 25 bu/ac at 200 lbs of N, investing additional 150 lbs of N (~$75/ac input) to increase yield by aproximatelly 10 bu/ac (~$50/ac in profit) was not economically justified (Figure 4, Table 2). However, if higher N inputs lead to increase in grain protein or baking and milling qualities that would make spring wheat more marketable, higher N inputs can be seen as a valuable investment. The economically optimal N rates for spring wheat across the range of grain market and N fertilizer prices is summarized in Table 2.
Conclusions
- Spring wheat has shown potential to be incorporated into a dryland crop production of western NE as a rotational crop to a continuous corn cropping sequence.
- The best variety in the trial yielded 20.2 bu/ac, which was 42% of the neighboring winter wheat.
- No-till was superior to vertical and conventional tillage, especially at higher N rates
- Economically optimal N rates for spring wheat in 2020 was 51 lbs of N/ac.
Prior to making any long-term recommendations, the study needs to be conducted for multiple year and at multiple location to account for environmental factors that influence variety performance and management practices.
Upcoming Resources on Spring Wheat
- Grain protein, baking and milling qualities - added to this report.
- Spring wheat state-wide variety performance at four western Nebraska locations.

| Grain price ($/bu) | Fertilizer price ($/lbs of N) | ||||
|---|---|---|---|---|---|
| 0.6 | 0.55 | 0.5 | 0.45 | 0.4 | |
| 4 | 25 | 31 | 37 | 44 | 51 |
| 5 | 40 | 45 | 51 | 58 | 66 |
| 6 | 51 | 57 | 63 | 70 | 78 |
| 7 | 61 | 67 | 73 | 80 | 88 |
| 8 | 70 | 76 | 82 | 89 | 97 |

