Kochia remains one of most challenging weeds to control in Western Nebraska. Kochia is and can be resistant to Group 5 (atrazine), Group 2 (imazamox), Group 9 (glyphosate), and Group 4 (dicamba) herbicides in Western Nebraska. While there are still many herbicides available to irrigated corn growers, those who grow dry beans and sugar beet have very few options because of crop rotation restrictions. In sugar beet, for example, if kochia becomes resistant to both Group 2 and 9 herbicides, growers have no more options for POST (post emergence) control. When a grower runs out of herbicide options, what can they do?
Integrated Weed Management (IWM) is often discussed as the solution. A simple definition of IWM is the strategic use of all the tools a farmer has available: herbicides, tillage, crop selection, crop rotation, cover crops, and other cultural practices. IWM is often discussed as a tool to both better manage weeds, and either lower the risk of developing herbicide-resistance or helping manage weeds after herbicide-resistance shows up. IWM doesn’t necessarily mean a grower will need to add more crops to a rotation, or start using tillage, but those tools may be an option to consider.
Study Methods
Does IWM actually work? In 2014 a study was established in Scottsbluff, NE; Lingle, WY; Powell, WY; and Huntley, MT to find out. The study ran for four years, concluding at each location in 2017. The goal of this study was to use IWM to target kochia in an irrigated crop rotation. Each site was established by seeding a mix of kochia biotypes of which 95% were susceptible to Group 2 (ALS-inhibiting herbicides) and 5% were resistant to Group 2 herbicides. The seed mixture used created a “low-level” of resistance in the seed bank, which simulates the early stages of herbicide-resistance development. In the first year of the study, even in the worst treatments, kochia density was near three or four plants in a square meter (m-2). However, by year four some treatments had kochia densities greater that 30 plants m-2.
Group 2 herbicide-resistance is similar to glyphosate-resistance in how resistant kochia behaves and persists within a field. Because of these similarities, the results of this IWM study can inform researchers and stakeholder about more than just one type of herbicide resistance.
Integrated Weed Management Strategies
- Minimal vs Intensive Tillage
- One, two, three, and four crop rotations
- Single mode of action, rotating mode of actions, and mixing modes of action.
Initial Results
- Herbicide Strategy had the biggest influence on kochia control.
- For crops sensitive to kochia competition, like sugar beet, integrated strategies using a diverse number of approaches can help control weed and preserve yields.
There were three IWM strategies, or factors, at each field location: the use of tillage, crop rotation, and herbicide strategy. The tillage strategy used two different treatments, minimal tillage or intensive tillage. With the minimal tillage treatment, no tillage occurred during the course of the study, however in rotations including sugar beet, the beet harvest process can disturb the soil in a manner similar to running a chisel plow through a field. For the intensive tillage treatment, a powered rotary tiller was used each season just prior to crop planting.
Four crop rotations were established, four years of continuous corn, a corn / sugar beet / corn / sugar beet rotation, a corn / sugar beet / corn / dry bean rotation, and finally a small grain / sugar beet / corn / dry bean rotation.
The final strategy was herbicide use, with three different treatments. A Group 2 herbicide only treatment, where only herbicides that wouldn’t control the resistant-kochia were applied every single year. A herbicide Mode of Action (MOA) rotation, where a Group 2 / alternative herbicide rotation, where an herbicide effective for Group 2-resistant kochia was used every other year. In corn for example, the effective herbicide was a tank mixture of glyphosate and dicamba. The last treatment was mixing MOAs, where an effective herbicide treatment was mixed with a Group 2 herbicide each year. For the rotation herbicide treatment, in 2014 and 2016 the alternative herbicide was used, and in 2015 and 2017 the Group 2 herbicide was used.
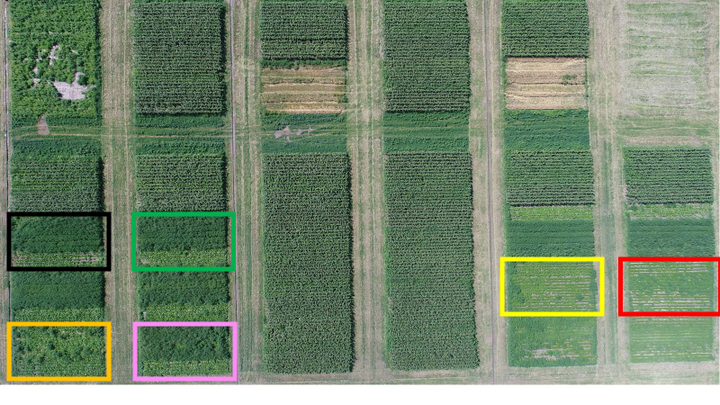
The study was hand weeded each year to remove any weeds that were not kochia from the study. Additionally, each treatment combination was replicated four times at each site, and each replication was begun in a different year of the rotation. In other words, the Small grain / sugar beet / dry bean / corn rotation had each crop growing each year of the study, but in different replicates. A drone image of the study can be seen below (Figure 1).

Study Results
Kochia has the potential to produce thousands of seeds per plant and reduce crop yield even at low densities. After four years of two different tillage strategies, the intensive tillage did reduce both kochia density and seed production (Table 2), but not at a level where tillage alone can be considered an effective management strategy. Similarly, moving from a continuous corn rotation to a diverse four crop rotation of corn, sugar beet, dry bean, and small grains did reduce both kochia density and seed production, but again not enough to provide economic control on its own.
Moving from a continuous corn rotation to a corn / sugar beet, or a corn / sugar beet / corn dry / bean rotation either led to increased kochia density and production, in the case of a two-crop rotation, or had no effect, in the case of the three-crop rotation.
What had the largest impact was the choice of herbicide. Using only a Group 2 herbicide every yea, resulted in the highest kochia density and highest kochia seed production. The MOA rotation strategy, rotating from a Group 2 herbicide to another effective mode of action every other year, resulted in less overall kochia plants and seed production. However, the biggest single impact of any treatment was using the mixed MOA herbicide strategy, which reduced average kochia density from 21 plants in a m2 to 1 plant in a m2, and reduced seed production from greater than 8,000 seeds to less than 500.
| Treatment | Kochia Density | Seed Production |
|---|---|---|
| Tillage | ||
| Intensive | 13.6 (4.5) | 4,670 (1,300) |
| Minimal | 11.4 (3.6) | 2,440 (640) |
| Crop Rotation | ||
| Continuous Corn | 6.89 (2.4) | 3,830 (1,300) |
| Corn and Sugar Beet | 15 (6.9) | 3,900 (1,400) |
| Corn, Sugar Beet, and Dry Bean | 10.8 (8.4) | 3,880 (2,900) |
| Corn, Sugar Beet, Dry Bean, and Small Grain | 5.9 (1.6) | 2,600 (1,100) |
| Herbicide Rotation | ||
| Group 2 Only | 21.7 (5.2) | 8,130 (2,400) |
| Mode of Action Rotation | 6.24 (1) | 2,060 (550) |
| Mode of Action Mix | 1 (0.5) | 480 (390) |
Discussion
From the results in Table 1, it appears that tillage and crop rotation didn’t have a very large impact on management of herbicide-resistant kochia, and that herbicide strategy was more important than using an integrated strategy. However, the numbers in Table 1 are a bit misleading. The numbers reported for the Tillage strategy are averaged across all crop rotations and herbicide strategies. Similarly, since the numbers reported for Crop Rotation and Herbicide Rotation are averaged across the other strategies, none of the numbers truly reflect an integrated weed management program, where multiple management strategies are used in conjunction with each to target a single weed. Did integrated weed management help?
While continuous corn can be considered the “baseline” or “control” treatment, corn can actually be fairly competitive against kochia. Sugar beet on the other hand is very susceptible to kochia competition. Corn can reach heights of six feet, while sugar beet only reaches a couple feet in height. Corn can close rows mid-season; sugar beet doesn’t grow large enough to close rows until late in the year. Because of these differences, some of the added benefits of different management strategies don’t show up when only looking at a competitive crop like corn. But within the sugar beet / corn rotation, every management strategy helps.
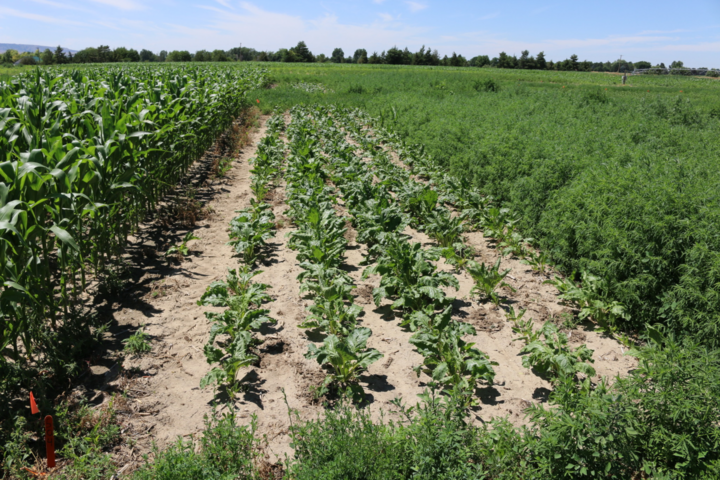
Figure 2 is a photo of the corn / sugar beet rotation, with minimal tillage. The center plot used an herbicide MOA mixture for four years, while the plot to the right only had Group 2 herbicides applied. The center plot has far less weeds than the Group 2 only plot to the right. The few weeds remaining in the center plot did impact yield at the end of the season and some of beets are visibly stunted from early season kochia competition.
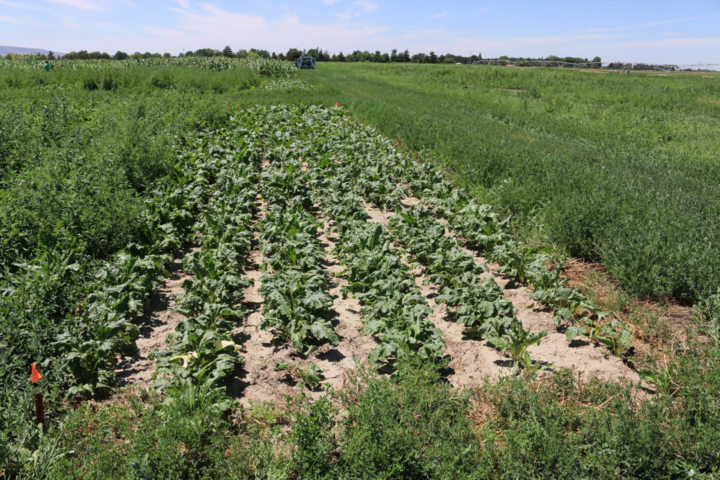
Figure 3, like figure 2, is a photo of the corn / sugar beet rotation with the herbicide MOA mixture, however the plot in Figure 3 used intensive tillage for all four years. The plot in figure 3 has no weeds, and 100% weed control was achieved. However, some of beets are visibly stunted from early season kochia competition, which was reflective in the yield at the end of the season.
Figure 4 adds another factor to the equation. We see in this photo sugar beet in the final year of a diverse (four crop) rotation, with intensive tillage, and the use of herbicide MOA mixtures. The big difference between Figure 3 and Figure 4, is the size of the beets. Kochia in Figures 2 through 4 was removed around mid-May when glyphosate was applied at the 2 TL sugar beet stage. All three photos indicate very good weed control, but the beets are still larger, and yielded higher, in Figure 4. This higher yield in Figure 4 is because of lower weed pressure prior to the application of glyphosate at the 2 TL stage. Integrating all three weed management strategies led to lower weed pressure, better season-long weed control, and higher yield, compared to just using the right herbicides.


Future work
The results reported in the post are a short introduction to what was observed at the Scottsbluff location. Four years of trial work, across four locations, with measurements of kochia density, seed production, and crop yield has resulted in quite a bit of data. I plan, in future CropWatch articles, to provide more detail into the study design, how results differed across locations, how crop yield was impacted, and even the economics of implementing and integrated weed management program.
