Four Key Findings to Date
- Yield response to applied N rates was evident only in the wet year.
- In some locations and years, there was an advantage to spring and split N application over fall.
- In a dry year, grain protein was elevated in an inverse reciprocation to the reduced grain yield.
- There is a potential for use of crop sensor in winter wheat N management.
Wheat producers in Nebraska endured a significant loss in profit due to reduced grain protein in years that had wet springs such as in 2016 and 2017. Among many potential factors, soil nitrogen (N) is the most central factor that affects protein levels in wheat. To investigate the effect of N on wheat grain yield and protein content, field trials across the State were initiated in 2018. In addition, a predictive N algorithm for dryland winter wheat production in western Nebraska was last prepared in 1970s by duo Professor Emeriti Jurg M. Blumenthal and Donald H. Sander (Historic Materials UNL Extension 768). Considering the progress made in traits and management, and changing climatic conditions, the need for re-assessing N recommendation in dryland winter wheat is warranted.
The specific objectives of the field study were to evaluate the effects of different N rates and application timing on grain yield and quality and to determine a potential use of crop sensor (hand-held and drone-mounted) in N management and grain yield estimation.
Field trials were conducted in 2018/2019 and 2019/2020 at four different locations across Nebraska (Figure 1; east to west): UNL Eastern Nebraska Research and Extension Center at Mead, the Henry J. Stumpf International Wheat Center near Grant, UNL High Plains Ag. Lab. near Sidney, and UNL Panhandle Research and Extension Center at Scottsbluff.
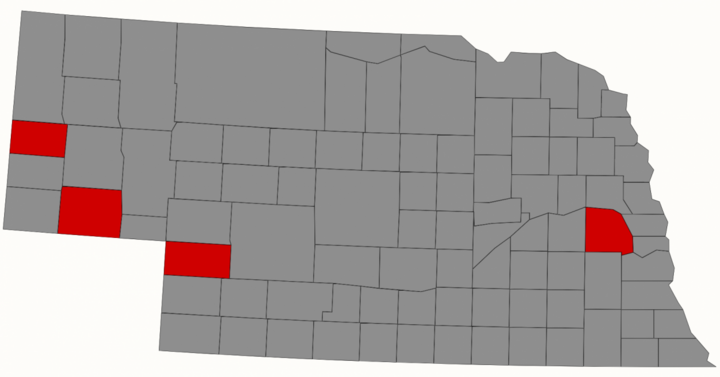
At all locations, the experimental layout was split plot randomized complete block design with four replications. The main plot factor was wheat variety (Ruth and Freeman). The sub plot factor was the combination of fertilizer N application timing (100% fall, 100% spring and split; 1/3 in fall and 2/3 in spring) and N rate (0, 25%, 50%, 75%, 100% and 125% of recommended N rate). Recommended N rate was estimated based on soil test and yield goal using the current UNL algorithm. Hand-held sensor (RapidScan CS-45) at all locations and UAV mounted with multi-spectral sensor (MicaSense RedEdge) were used to collect different vegetative indices at various crop growth stages at Mead and Scottsbluff.
Results (by Research Sites)
Mead
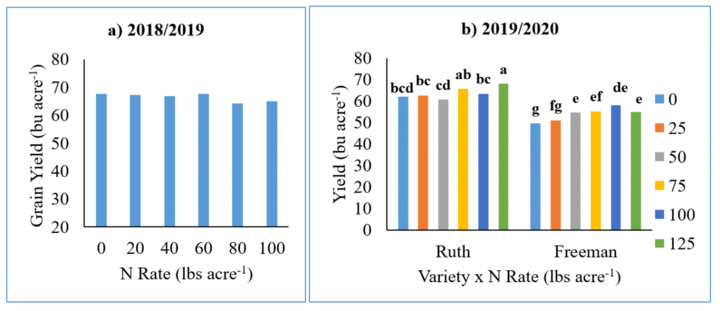
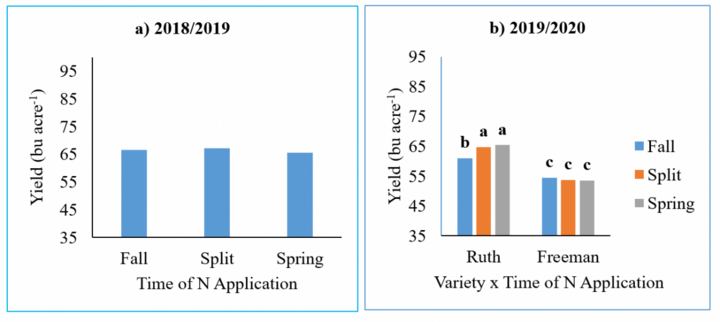
In 2018/2019, the average yield was statistically greater with Freeman (64.4 bu/acre) than with Ruth (53.8 bu/acre). Gain in grain yield was not observed with increasing applied N rates (Figure 2a). This result might be because of Fusarium Head Blight (FHB), among other factors. The severity of FHB could be higher in wheat fertilized with higher N rates. No effect of N application timing on grain yield was observed (Figure 3a).
In 2019/2020, a significant interaction effect of variety x N rate was observed (Figure 2b). All N rates yielded higher for Ruth compared to the Freeman. There was a small yield gain at higher N rates compared to the control or low N rates for both varieties. In addition, significant Variety x Application timing effect on grain yield was observed (Figure 3b). For Ruth, there was a small yield gain for split and spring N applied plots compared to the fall N applied plots. However, no such difference was observed with Freeman.
Grant
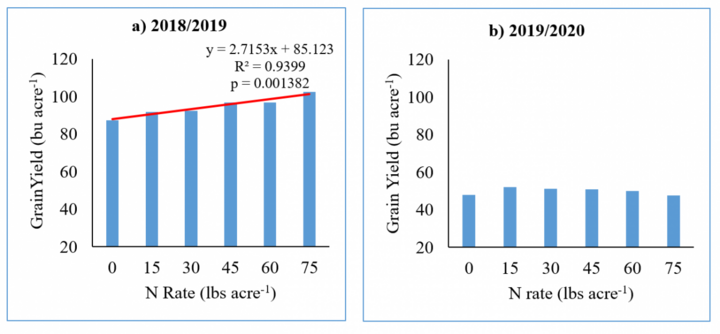
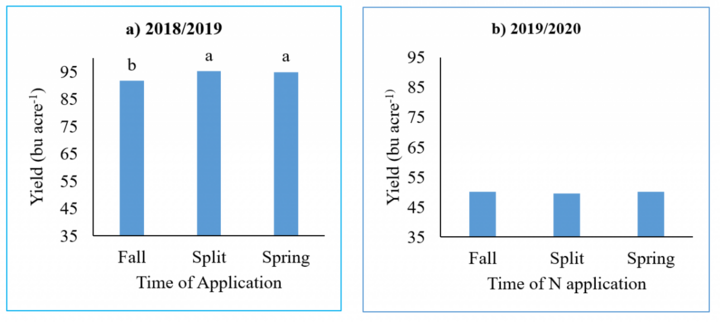
In 2018/2019, there was no effect of variety on grain yield, but N application rate and timing each showed significant effect on grain yield (P
In 2019/2020, at Grant, N rate did not show any significant effect on grain yield (Figure 4b). Average yield obtained across N rates was lower than that in 2018/2019. Precipitation during the growing season was lower than the 30-year normal. This decrease in rainfall might have affected grain yield and resulted in no significant yield differences across N rates. Similarly, there was no effect of N application timing on grain yield (Figure 5b).
Sidney
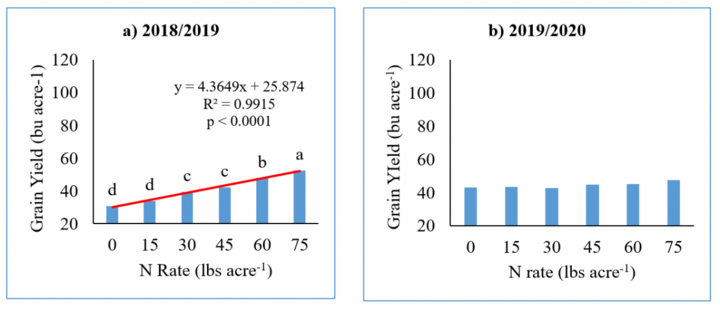
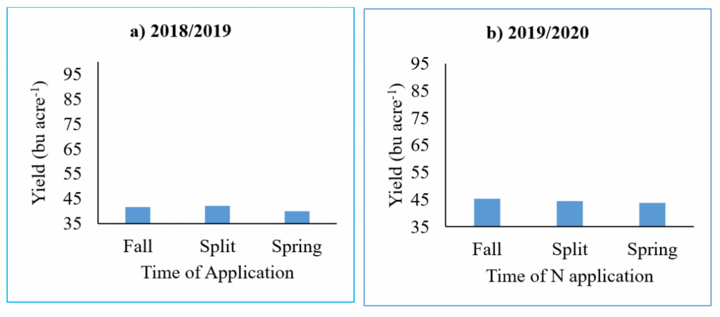
In 2018/2019, the results showed that variety and N rates each had significant main factor effect on grain yield. Ruth had significantly higher yield than Freeman (P
In 2019/2020, no significant effect of N rate on grain yield was observed (Figure 6b). Maximum yield (47.57 bu acre-1) was obtained with the highest N rate. N application timing did not have any effect on grain yield (Figure 7b).
Scottsbluff
Due to the hailstorm damage, there was no yield data from the plots at Scottsbluff in 2018/2019. In 2019/2020, no significance difference in yield was observed with N treatments (Figure 8). The higher residual soil N (pre-planting) in the plots combined with lower than normal precipitation might have resulted in no yield difference across N treatments.

Grain Protein
The 2018/2019 results showed that N rates had significant effect on grain protein at all locations. The highest protein level (reported on 14% moisture basis) was always below 10% at Grant and Sidney. In contrast, higher grain protein levels (>10 %) were achieved at all N applied plots at Mead with the highest (11.35 %) in plot applied with 100 lbs N acre-1. No significant difference was observed in grain protein among the N application timing at any of the locations.
In 2019/2020, significant effect of N rates on grain protein was observed at Grant, Sidney, and Scottsbluff (grains from Mead are yet to be analyzed for protein). The protein level was always highest for the highest N rate and lowest for the control plots. The protein level (reported on 14% moisture basis) ranged from 14.58 % to 15.70 % at Grant, from 12.59 % to 13.73 % at Sidney, and from 12.54 % to 13.65 % at Scottsbluff.
Precipitation Pattern at Study Sites
| Parameter/Location | Grant | HPAL | MEAD | Scottsbluff |
|---|---|---|---|---|
| 30-yr Normal Precipitation (1980-2010) | 18.21 | 14.86 | 25.69 | 14.16 |
| Total Precipitation (2018/2019) | 21.12 | 23.89 | 32.09 | 16.88 |
| Total Precipitation (2019/2020) | 13.52 | 11.67 | 21.81 | 10.25 |
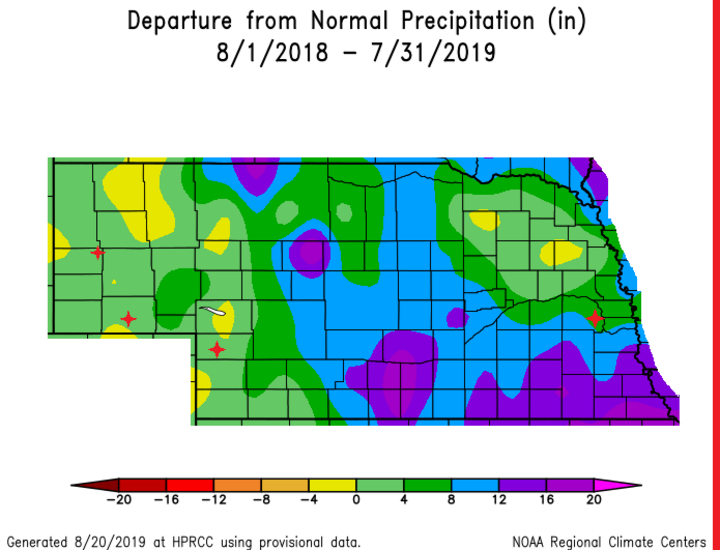
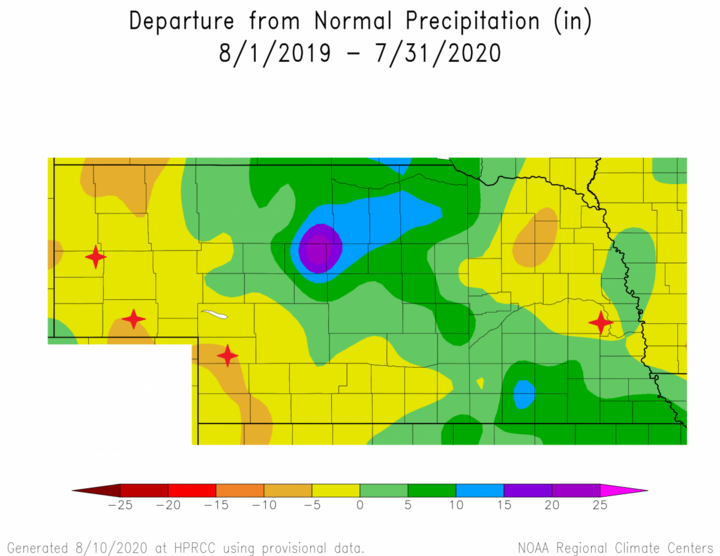
The precipitation data from the two growing seasons showed that there was above average precipitation in 2018/2019 while a below average precipitation in 2019/2020 (Table 1, Figure 9). Availability of enough moisture during the major growth stages such as tillering, booting, heading, and flowering is critical to sufficiently meet crop water use and enhance crop growth as well as fertilizer use. This evident precipitation difference over two seasons might explain considerably high yield across N treatments in 2018/2019 and a lower yield in the dry year (2019/2020). This reduced yield in 2019/2020 due to weather resulted in significant treatment differences in grain protein across the locations. At all locations, the grain protein was elevated in an inverse reciprocation to the reduced grain yield.
Crop Sensing for In-season Nitrogen Management
In 2018/2019, significant effect of N rates on Normalized Difference Vegetation Index (NDVI) collected with handheld crop sensor was observed at all the experimental sites. A strong correlation of NDVI with N rates suggests the potential use of crop sensors in assessing in-season N status of wheat crop. Further, a regression between NDVI and yield showed a significant positive correlation suggesting potential application of crop sensors in yield estimation. The data from 2019/2020 are yet to be analyzed.
Drone and Crop Sensor for Crop Sensing
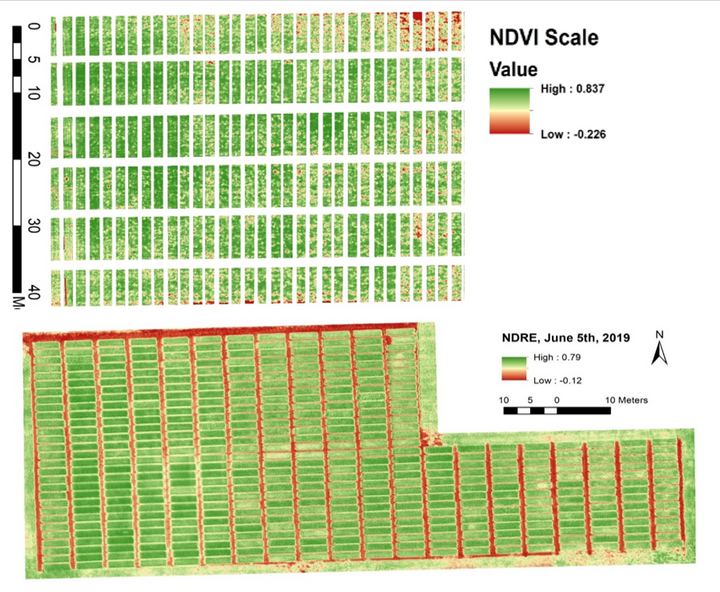
The images from the drone-mounted sensor were analyzed to extract the vegetative indices (Figure 10). The vegetative indices were correlated to N treatments and yield to explore the effectiveness of use of drone for crop sensing in wheat field. Preliminary analysis results showed significant differences in NDVI values under different N rates which suggests the potential use of drone-mounted crop sensor in assessing in-season winter wheat N status.
Summary
Over the past two years of the study across multiple locations, we found that yield response to applied N rates was evident only in the wet year. In a dry year, grain protein was elevated in an inverse reciprocation to the reduced grain yield. These findings suggest for the need to be able to manage and adjust N according to weather, particularly to spring moisture. There were benefits of applying N in spring or split over fall application, but the effect was not consistent across sites and years. There is much to do before crop sensors can be used in winter wheat N management in the state, but we have encouraging results suggesting their potential use.
