Based on surveys conducted during seven teaching sessions in 2019/20, 40% of the attendees representing 137,000 acres of irrigated soybean production in western NE reported to chemigate some level of N fertilizer during the soybean reproductive stages (25-50 lbs N /ac most common rate). Main reasons for adoption of this practice is based on the notion that biological fixation and residual soil N are often not able to meet N demand of high yielding soybean (> ~70 bu/ac).
Mortzinis et al. (2017) composed data from 207 environments (site-years) across the 16 land-grant universities to find only a minimal effect of N (0-2 bu/ac yield increase) on soybean. In addition, authors suggested that variability in response to N can depend on differences in soybean cultivars, soil properties, weather conditions, and/or agronomic practices (Mortzinis et al. 2017). There are, however, a few studies from eastern parts of Nebraska (Cafaro La Menza et al. 2018, Wortmann et al. 2012) and Kansas (Wesley et al. 2014) where researchers quantified yield responses to N fertilizer sufficient to justify the additional expense associated with the application. In one study, application of 27 lb/ac N at R3 caused average yield increase of 1.1. bu/ac across 44 locations with > 60 bu/ac yield, while no additional yield increase was observed with the application of 54 lbs of N/ac.
Soybean Response to Late Season N in Western NE
In 2017, on-farm research studies were conducted in three southwest counties (Perkins, Chase and Lincoln) with no increase in yield or grain protein with the application of 80 lbs of N/ac at R3 (beginning pod) soybeans. In addition, large inefficiency of N fertilizer utilization (~13%) was observed, with the only notable difference being a 5-14 lbs of N/ac increase in crop residue. The study protocol was changed in 2018 to chemigate less fertilizer (50 lbs of N/ac) at later growth stages (R5-beginning seed) growth stages, but similar outcomes were observed. Leaf tissue analysis in all studies tested low on magnesium (Mg), while N and all other macronutrients and micronutrients remained within the sufficiency range for the most of the soybean growing season.
Biologicals and Compost in Soybean - Why not Try?
When Jimmy Frederick from Rulo, NE (eastern NE) raised 138 bu/ac soybeans to win 2017 state and national dryland soybean yield competition, many farmers wanted to learn from his approach. Mr. Frederick did not apply any synthetic N fertilizers and based his entire fertility program on biological products. In our 2018 fertility study in western NE, early planted soybeans in 15 inch rows benefited from pre-plant application of compost at 5 ton/ac, yielding as much as 107 bu/ac (results of one year at one location). Such outcome initiated a need to repeat the study and look more into the other fertility treatments to that might increase soybean yield.
Soybean Fertility Research in 2019
Public universities and private companies were contacted early in 2019 to provide input on the study protocol that would compare multiple fertility programs for soybeans in western NE. Total of 12 fertility programs were compared including: inoculant only, high N control (400 lbs of N/ac), cow and chicken manure applied both broadcast and in-furrow, two levels of Mg fertilizer, and four programs based on seed and foliar treatments recommended by our local fertilizer suppliers (Table 1). All treatments were planted to same soybean variety, GH2499X (Golden Harvest 2.4 maturity) and replicated three times with individual plots being 20 ft wide (8 rows) x 60 ft long. The study was conducted only at one location (Grant, NE) and the following data was collected in each experimental plot: bi-weekly soil and tissue samples, yield, grain quality (protein and oil), and yield components (plants/acre, nodes/plant, branches/plant, pods/plant, seed weight).
| Trt | Fertility treatment | Application time | Application method | Products and rates used |
|---|---|---|---|---|
| 1 | Control - Inoculant | Planting | seed treatment | Inoculant - Verdesian @ 2x rate |
| 2 | Control - High N | Pre-plant Planting | broadcast seed treatment |
Urea (46-0-0) @ 869 lbs /ac (400 lbs of N/ac) Inoculant - Verdesian @ 2x rate |
| 3 | Chicken manure broadcast |
Pre-plant Planting |
broadcast seed treatment |
Beju chicken manure (pelleted) @ 12 ton/ac Inoculant - Verdesian @ 2x rate |
| 4 | Cow manure broadcast |
Pre-plant Planting |
broadcast seed treatment |
Beju cow manure (pelleted) @ 12 ton/ac Inoculant - Verdesian @ 2x rate |
| 5 | Chicken manure in-furrow |
Planting | seed treatment insecticide box |
Inoculant - Verdesian @ 2x rate Beju chicken manure (powdered) @ 25 lba/ac |
| 6 | Cow manure in-furrow |
Planting | seed treatment insecticide box |
Inoculant - Verdesian @ 2x rate Beju cow manure (powdered) @ 25 lba/ac |
| 7 | Mg High Rate |
Pre-plant Planting |
broadcast seed treatment |
MgSO4 @ 750 lbs/ac (270 lbs Mg/ac) Inoculant - Verdesian @ 2x rate |
| 8 | Mg Low Rate |
Pre-plant Planting |
broadcast seed treatment |
MgSO4 @ 388 lbs/ac (140 lbs Mg/ac) Inoculant - Verdesian @ 2x rate |
| 9 | Aurora Starter + Foliar |
Planting Planting V3 V6 R2 R5 |
seed treatment seed treatment foliar foliar foliar foliar |
Inoculant - Verdesian @ 2x rate Hustle @ 1 gal/ac Heighten @ 8 oz/ac (no product label) + Realize @ 2 oz/ac Heighten @ 8 oz/ac (no product label) + Realize @ 2 oz/ac Realize @ 4 oz/ac + N-cline @ 1 gal/ac + Evito @ 2 oz/ac Boron + Molybdenum (no product label) @ 1 qt/ac |
| 10 | Nutrien 1 Starter only |
Pre-plant Planting |
broadcast seed treatment |
Micro Starter @ 0.3 gal/ac (no product label) Inoculant - Verdesian @ 2x rate |
| 11 | Nutrien 2 Starter + Foliar |
Pre-plant Planting R2 |
broadcast seed treatment foliar |
Micro Starter @ 0.3 gal/ac (no product label) Inoculant - Verdesian @ 2x rate NutriSyncD @ 10 oz/ac |
| 12 | Kugler Foliar products |
Planting V2 V3 R2 R5 |
seed treatment foliar foliar foliar foliar |
Inoculant - Verdesian @ 2x rate KS178c @ 1 gal/ac + LS624 @ 1 gal/ac + FA20 @ 1 gal/ac KS2075 @ 1.5 gal/ac + LS624 @ 0.5 gal/ac + FA20 @ 1 pt/ac KS2075 @ 2 gal/ac + FA20 @ 1 pt/ac KS2075 @ 1 gal/ac + LS624 @ 1 gal/ac + FA20 @ 1 pt/ac |
Key takeaways
Fertility treatments had no impact on soybean
Fertility treatments had no impact on soybean yield, grain protein, seed oil content, or any of the other yield components measured in the study (Table 2). Furthermore, no differences between the fertility treatments were observed in any of the soil and tissue analysis performed at seven different growth stages. The only notable difference was the higher levels of sulfur (S) in the soil where cow and chicken manure were applied.
| Trt | Treatment name | Soil pH | Yield (bu/ac) | Grain Protein (%) | Grain Oil (%) | Plants/ac | Nodes/plant | Branch/plant | Pods//plant | Seed/pod | 1000 Seed weight (g) |
|---|---|---|---|---|---|---|---|---|---|---|---|
| 1 | Control - Inoculant | 6.4 | 77 | 35.7 | 21.1 | 111078 | 15 | 3.1 | 41 | 2.5 | 149 |
| 2 | Control - High N | 6.6 | 74 | 35.7 | 21 | 83345 | 15 | 3.8 | 62 | 2.5 | 162 |
| 3 | Chicken manure - broadcast | 6.8 | 78 | 34.9 | 20.8 | 96122 | 15 | 3.2 | 46 | 2.5 | 168 |
| 4 | Cow manure - broadcast | 6.4 | 73 | 35.5 | 20.9 | 102511 | 15 | 3.5 | 50 | 2.5 | 154 |
| 5 | Chicken manure - in-furrow | 6.5 | 74 | 35.5 | 21 | 117903 | 15 | 3.3 | 50 | 2.3 | 154 |
| 6 | Cow manure - in furrow | 7.2 | 76 | 35.3 | 21.4 | 114345 | 15 | 3.2 | 45 | 2.3 | 160 |
| 7 | Mg - High rate | 6.4 | 78 | 35.3 | 20.9 | 124582 | 15 | 3.1 | 47 | 2.4 | 151 |
| 8 | Mg - Low rate | 6.4 | 78 | 35.7 | 20.7 | 112965 | 15 | 3.3 | 51 | 2.5 | 150 |
| 9 | Aurora - Starter + Foliar | 6.8 | 74 | 34.5 | 20.6 | 116044 | 15 | 3 | 44 | 2.3 | 153 |
| 10 | Nutrien 1 - Starter only | 6.2 | 77 | 36 | 20.9 | 121097 | 14 | 3.4 | 47 | 2.4 | 155 |
| 11 | Nutrien 2 - Starter + Foliar | 6.1 | 76 | 36 | 21 | 111804 | 15 | 2.9 | 43 | 2.4 | 162 |
| 12 | Kugler - Foliar products | 6.8 | 76 | 35.5 | 21 | 116450 | 15 | 3 | 44 | 2.4 | 155 |
| Average of all treatments | 6.6 | 75.9 | 35.4 | 20.9 | 111057 | 15 | 3.2 | 47 | 2.4 | 155 | |
| Difference at 5% significance | 1.1 | 12 | 1.4 | 0.94 | 22863 | 1.5 | 0.9 | 11 | 0.2 | 7 | |
| Coefficient of variation | 10.4 | 11 | 2.5 | 2.83 | 13 | 6.6 | 16.7 | 15 | 4.8 | 18 |
N supply was not a yield-limiting factor in soybeans (73-77 bu range)
The High N treatment (400 lbs of N/ac) had 53 lbs of N/ac left in top 24 inches of the soil at the end of season, which was 23 lbs of N/ac more than what was left behind the soybeans inoculated with rhizobia (data not shown). With plenty of N left in the soil and yields similar to those of other treatments we can conclude that N supply was not a yield limiting factor in this study (Table 2).
Soybeans will compensate for the loss of stand.
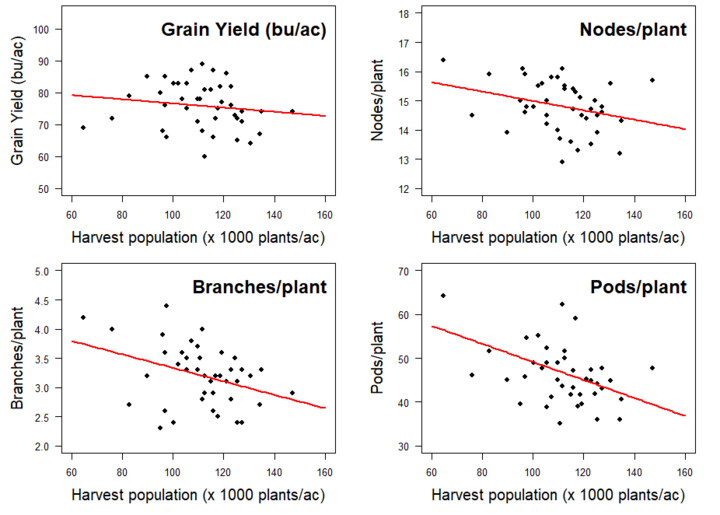
Although range of harvest populations were observed in the study plots (64,000 to 147,000 plants/ac) no yield increase was observed at higher populations due to lower number of nodes, branches and pods on individual soybean plants (Figure 3). These findings are in agreement with our 2018 research results and with the results of many other on-farm research trials conducted in Nebraska.
Soil pH was the main factor limiting soybean yield and grain protein
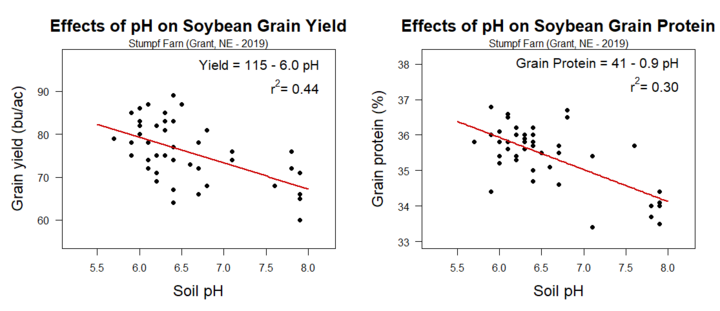
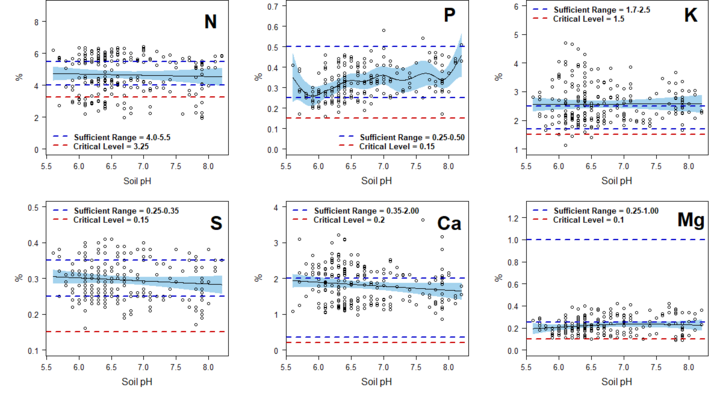
Despite the relatively flat topography, uniform soil type, similar soil organic matter (OM) and cation exchange capacity across the study area, soil pH varied significantly from plot to plot (5.6 to 8.2). Correlation analysis in Table 3 suggests that significant portion of variability in soybean yield and grain protein can be explained by changes in soil pH. For example, 10 bu reduction in yield and 1.5% reduction in grain protein was observed when soil pH > 7.5 (Figure 2).
| Parameter | Soil pH | Yield | Grain protein (%) | Grain oil (%) | Plants/ac | Nodes/plant | Branch/plant | Pods/plant | Seed/pod |
|---|---|---|---|---|---|---|---|---|---|
| Yield | -0.55* | ||||||||
| Grain protein | -0.67* | 0.35* | |||||||
| Grain oil | 0.05 | 0.09 | -0.06 | ||||||
| plants/ac | 0.24 | -0.15 | -0.1 | -0.04 | |||||
| nodes/plant | -0.03 | 0.12 | -0.01 | -0.15 | -0.3 | ||||
| branches/plant | -0.26 | 0.07 | 0.29 | -0.28 | -0.36* | 0.39* | |||
| pods/plant | 0.17 | -0.06 | -0.09 | -0.1 | -0.42* | 0.56* | 0.47* | ||
| seeds/pod | -0.22 | 0.28 | 0.14 | -0.08 | -0.21 | -0.01 | 0.21 | 0.07 | |
| 1000 seed weight (g) | -0.16 | 0.22 | 0.26 | -0.02 | -0.39* | -0.04 | -0.09 | 0.08 | 0.03 |
* Correlation coefficient significant at 5% level. The sign of coefficient indicates the nature of relationship (either positive + or negative -) while the magnitude of coefficient (ranging from 0 to 1) represents the strength of the linear relationship.
Magnesium (Mg) uptake hindered
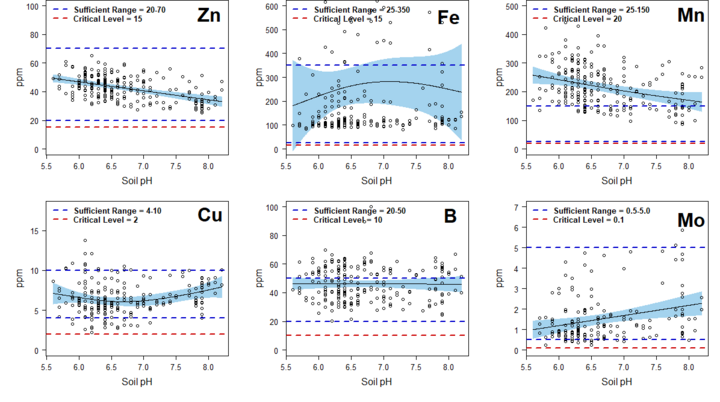
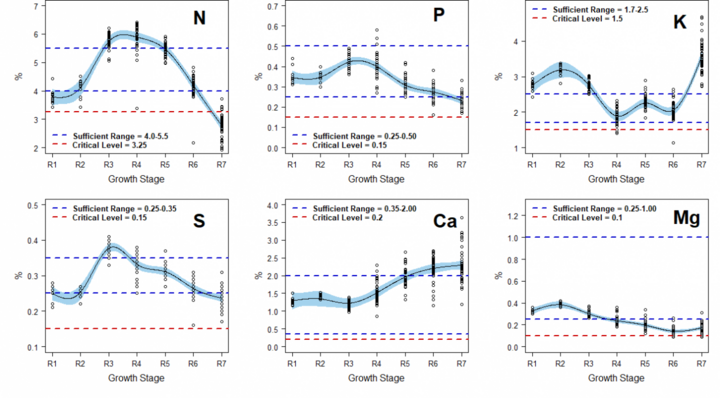
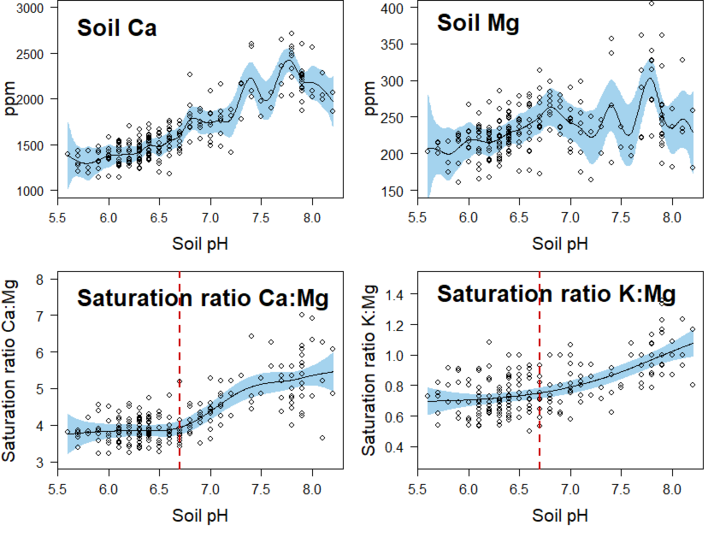
Magnesium levels in tissue samples were at the lower end of sufficiency range in the early reproductive (R1-R3) and were approaching the critical level during late reproductive stages (R3-R7; Figure 3). The decrease in Mg levels at late reproductive stages (R3-R4) coincided with the sharp increase of Ca concentration in the soybean tissue, suggesting a plausible inhibitory (i.e. unlikely preferential) uptake of Ca over Mg (Figure 3). As soil pH increased so did the concentration of both Ca and Mg in the soil solution (Figure 4). However, Ca concentration in soil solution increased disproportionally compared to Mg, which caused Ca:Mg saturation ratio (and K:Mg) to increase, especially at soil pH levels > 6.7 (Figure 5). We hypothesize that Mg uptake in soybean, especially in late reproductive stages, may be hindered due to soil replenishing with disproportional amount of Ca into the soil solution.
Molybdenum (Mo) levels low at late reproductive stages
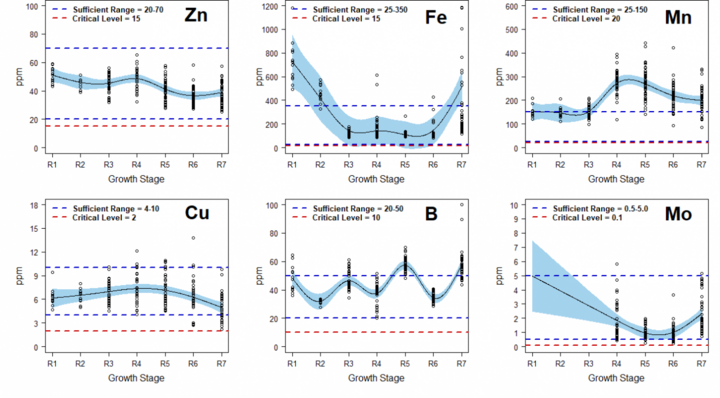
Molybdenum levels in soybean tissue were at the lower end of sufficiency range during the seed filling period (Figure 6 and 7). As Mo is not included in standard soil and tissue testing for soybeans, we lack data on soil levels and early reproductive tissue analysis. Molybdenum pays an important role in soybean N-fixation and increasing its availability to the plant at late reproductive stages may help soybean maintain high rates of N-fixation. All other micronutrients were within the sufficiency range throughout the growing season.
Recommendations
The results of this study validate the current UNL fertilizer recommendations for soybean, especially when it comes to avoiding the routine application of N fertilizer. The need for N fertilizer cannot be predicted by soil tests; therefore, an in-season tissue sampling as well as inspecting root nodule number, spread and activity is advised prior to making such decision. Soybean response to N is, however, more likely to occur in high-yielding environments (> 80 bu/ac) and in certain conditions such as soil pH Wortmann et al. 2018). When it comes to applications of compost, manure, and other specialty products (micronutrients, foliar products, etc.), more research is needed to identify specific environmental conditions and soybean varieties where those applications might be warranted.
Soil pH was found to be the main factor influencing soybean yield and grain protein content. Significant decline in soybean yield and grain protein was observed at pH > 7.5., which is outside the optimal pH range (5.5-7.0) for soybean nutrient uptake and biological N-fixation. Recent advances in on-the-go field mapping for various soil properties and areal/satellite imagery can help farmers identify areas of the field with high soil pH and treat them as site-specific zones. Improving soybean management when soil is calcareous with pH > 7.5, especially if symptoms of lime induced chlorosis have been previously observed, may include: careful use of herbicides, planting iron-deficiency tolerant varieties at higher seeding rates in 30 inch rows, avoiding high soil nitrate levels, and applying chelated-iron in-furrow.
Tissue analysis in the past few years have consistently showed low/critical levels of magnesium both in our soybean research studies and on-farm samples. Soil analysis, however, always indicated adequate supply of Mg and range of Ca:Mg saturation ratio that is considered optimal for soybean producing. Significant amounts of Mg are applied in irrigation water. Furthermore, we observed no yield increase (or increase in levels of Mg in tissue) with the application of 140 and 270 lbs of Mg/ac; approximately 30 lbs of Mg/ac was applied through the irrigation water. Although it appears that Mg uptake is somewhat hindered by large amounts of Ca, soybeans had no yield response to applied Mg fertilizer in western NE.
References
Cafaro La Menza N, Monzon JP, Specht JE, Grassini P. 2017. Is soybean yield limited by nitrogen supply?. Field Crops Res. 213, 204-212.
Balboa G. R., D.R. Hodgins, I.A. Ciampitti. 2015. Late-Season Nitrogen Fertilizer Application in Soybean. Kansas Agricultural Experiment Station Research Reports: Vol. 1: Iss. 2. https://doi.org/10.4148/2378-5977.1016
Cafaro La Menza N., P. J. Specht, J. Rees, A. Timmerman, T. Whitney, and K. Glewen. 2018. Is Soybean Yield Limited by Nitrogen Supply? Nebraska Extension Crop Watch (January 8, 2018)
Grassini P., J. Rees N. Cafaro La Menza, and J. Specht. 2016. What does it take to produce 80+ bu/ac soybean? (EC 3000) UNL Extension Circular
Jimmy Frederick Booms 163 Bu. 2017. AgWeb Farm Journal (Feb 27, 2018)
Mortzinis S., G. Kaur, J. Orlowski, C. Shapiro, C. Lee, C. Wortmann, D. Holshouser, E. Nafziger, H. Kandel, J. Niekamp, J. Ross, J. Lofton, J. Vonk, K. Roozeboom, K. Thelen, L. Lindsey, M. Staton, S. Naeve, S. Casteel, W. Wiebold, and S. Conley. 2017. Soybean response to nitrogen application across the United States: a synthesis-analysis. Field Crops Res. 215:74-82. doi.org/10.1016/j.fcr.2017.09.035
Stepanovic S. N. Arsenijevic, Z. Ugljic. 2018a. Is Late Season N Fertilization Warranted for Irrigated Soybean in Western Nebraska? Nebraska Extension Crop Watch (November 2, 2018)
Stepanovic S., N. Arsenijevic, Z. Ugljic. 2018b. Seeding Practices and Nitrogen Management for Western Nebraska Soybean: What Matters and Why. Nebraska Extension Crop Watch (December 18, 2018)
Wesley, R. E. Lamond, V. L. Martin and S. R. Duncan. 2013. Effects of Late-Season Nitrogen Fertilizer on Irrigated Soybean Yield and Composition. J. Prod. Agric., Vol. 11 No. 3, p. 331-336
Wortmann, C.S., B.T. Krienke, R.B. Ferguson, B. Maharjan. 2018. Fertilizer recommendations for soybean. G859, revised, link: http://extensionpublications.unl.edu/assets/pdf/g859.pdf
Wortmann, C.S., C.A. Shapiro, R. Ferguson, and M. Mainz. 2012. Irrigated soybean has a small response to nitrogen applied during early reproductive growth. J. Crop Manage.
Balboa G. R., D.R. Hodgins, I.A. Ciampitti. 2015. Late-Season Nitrogen Fertilizer Application in Soybean. Kansas Agricultural Experiment Station Research Reports: Vol. 1: Iss. 2. https://doi.org/10.4148/2378-5977.1016
