In a stark contrast to 2019, this year’s growing season was drastically drier which meant that participants in the Testing Ag Performance Solutions (TAPS) program had to focus more attention on their irrigation and nitrogen management decisions this year.
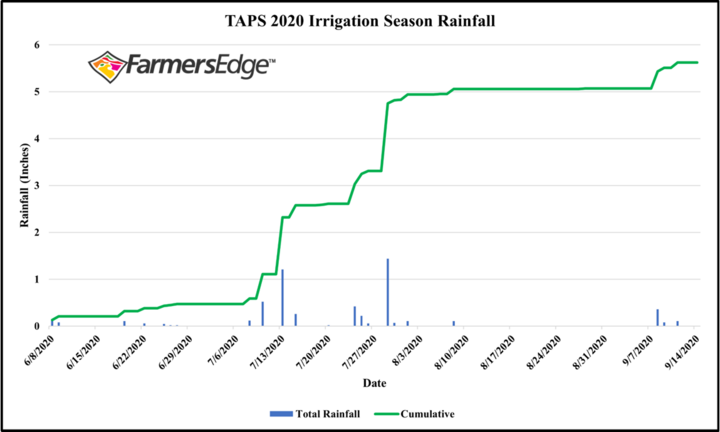
According to the Farmers Edge rain gauge, located on the edge of the TAPS pivot field in North Platte, Nebraska, only 5.62 inches of rainfall was collected during the TAPS irrigating season of June 8 to September 14 (Figure 1). In comparison, the last three years’ cumulative rainfall from May 1 to September 30 was 21.2 inches, 14.9 inches, and 18.2 inches in 2019, 2018 and 2017 respectively.
The following is a brief summary of the irrigation and nitrogen decisions made in each competition this year. Please watch for more information to be released as the data is analyzed.
Sprinkler Corn
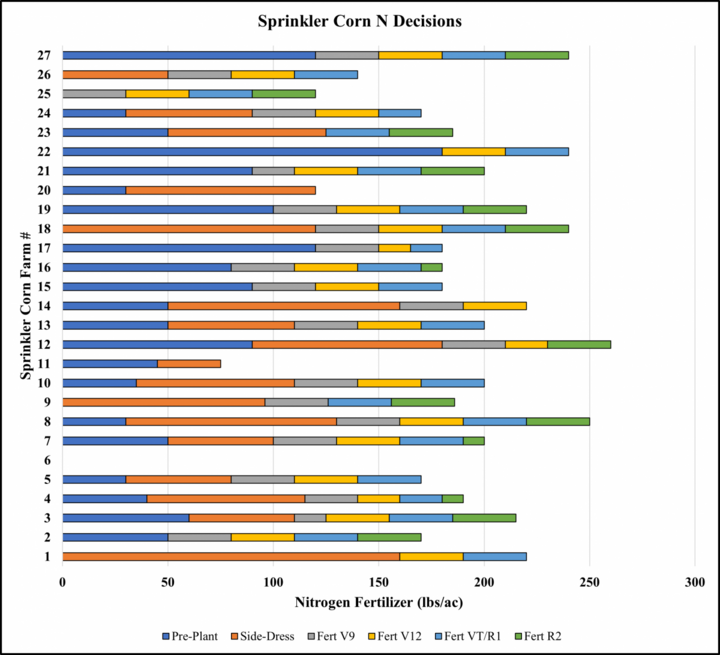
Among the 27 teams in the sprinkler corn competition, no two teams were identical in how they managed their N fertilizer (Figure 2). The total N applied ranged from 120 to 260 lbs/acre, excluding the control plot which received no N fertilizer. All but four teams chose to apply a portion of their N fertilizer as pre-plant and all teams, except one, utilized fertigation. On July 17th, at the VT growth stage, leaf tissue samples were collected and submitted to Ward Laboratories in Kearney, NE, to determine N sufficiency. Participants were provided this information prior to the final fertigation scheduled. Several teams took this opportunity to adjust their final N fertilizer rate. However, seven teams had values over 3.4% which is considered high. Of these seven teams, four opted to withhold while three applied additional N fertilizer. The outcomes of these decisions will be further assessed following biomass and grain nutrient uptake sampling as well as observing the in-season sensor response data provided by our industry partners.
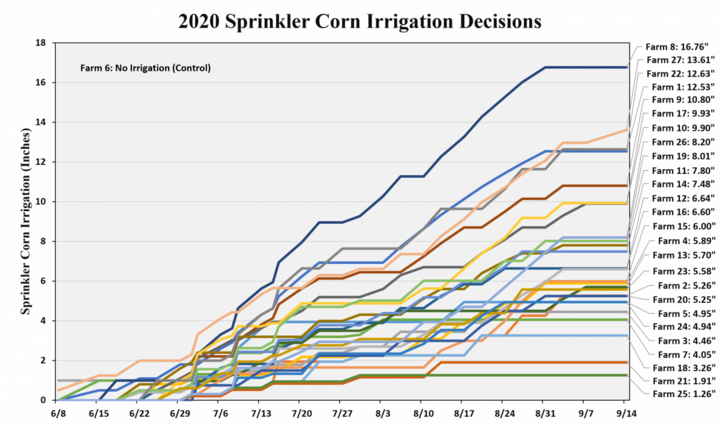
Two teams (Farm 3 and 27) first initiated the irrigation system on June 8, nearly one month prior to the first irrigation in 2019, and concluded on September 14 by Farm 27. With the exception of the control (Farm 6), the total irrigation applied among the corn teams ranged from 1.26 (Farm 25) to 16.76 inches (Farm 8) with an average of 7.29 inches. There were only two days during the irrigation season that the system was not initiated, June 11 and September 11. All other irrigation days had between one and 17 teams choosing to irrigate, excluding fertigation operations (Figure 3).
SDI Corn
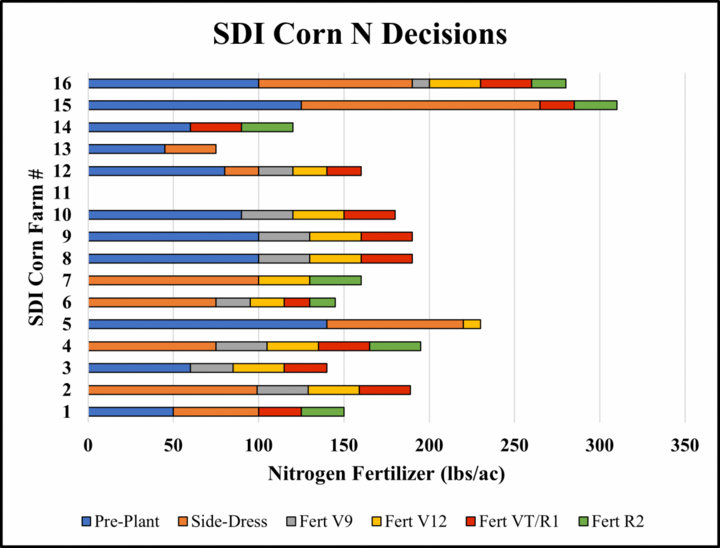
The seasonal N fertilizer applied in the subsurface drip irrigation (SDI) corn competition ranged from 120 to 310 lbs/ac (Figure 4). Four teams chose to forgo pre-plant, five chose to forgo side-dress, but all except one team chose to apply a portion of their N fertilizer via fertigation. As in the sprinkler corn competition, leaf tissue samples were collected at the VT growth stage on July 16th and sent to Ward Laboratories to determine N sufficiency. Likewise, teams were provided the lab recommendations prior to the final fertigation decision. This information coupled with additional technology (e.g., imagery) was used to guide and readjust initial N fertilizer plans. For example, two teams that had originally planned to apply 30 lbs/ac during the 4th fertigation chose to cancel their decisions after reviewing their sampling results.
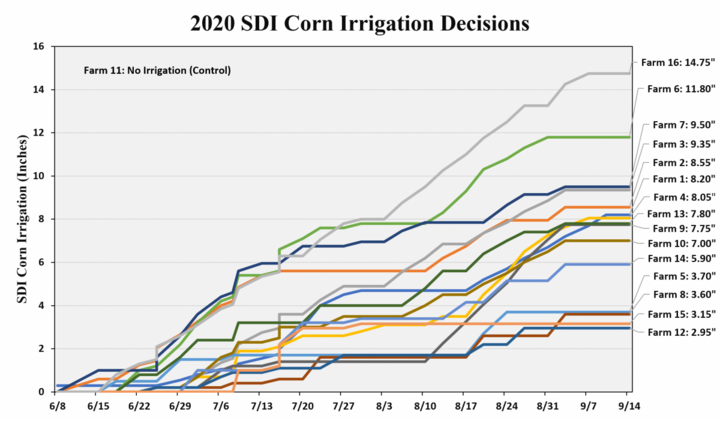
The SDI irrigation system was first initiated by Farm 1 on June 8 and concluded on September 10, also by Farm 1. With the exception of the control (Farm 11), the total irrigation applied among the SDI corn teams ranged from 2.95 (Farm 12) to 14.75 inches (Farm 16) with an average of 7.47 inches (Figure 5). On average, the SDI corn competition farms applied only 0.18 inches more irrigation than the pivot corn competition.
Sorghum
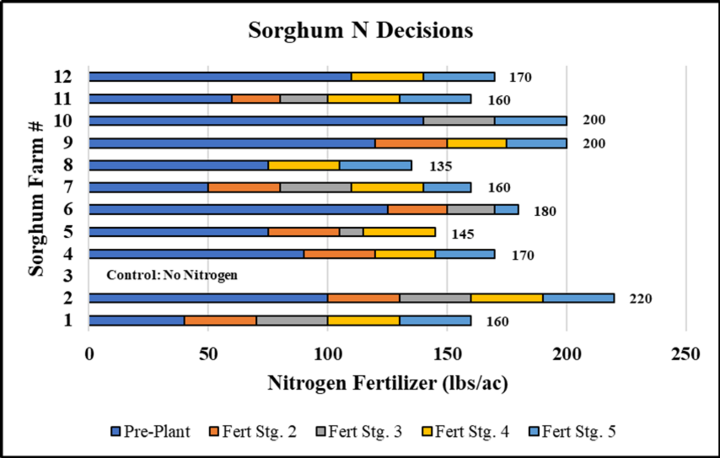
Among the twelve sprinkler sorghum teams, the seasonal N fertilizer decisions ranged from 135 to 220 lbs/ac (Figure 6). None of the teams chose to apply their N in the same manner, although a few chose the same total amounts. All teams chose to apply N during the pre-plant opportunity and then followed with at least 2 fertigations. The average N amount applied, excluding the control, was 173 lbs/ac.
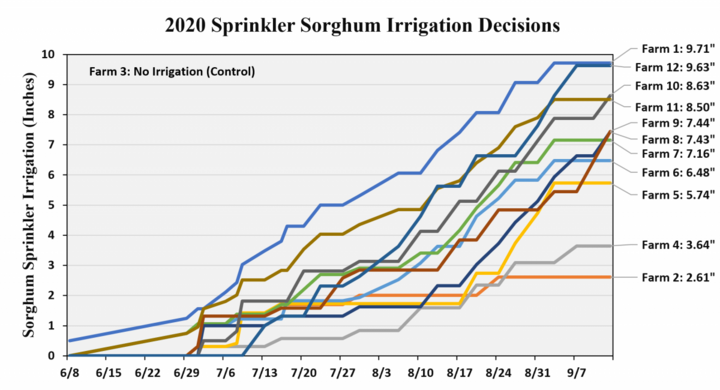
The irrigation system on the sorghum competition was initiated on June 8, the first day irrigation could be applied, by the scheduling of irrigation by Farm 1, and concluded on September 13 when Farms 8, 9, and 10 scheduled irrigation. With the exception of the control farm (Farm 3), the total irrigation applied among the sorghum teams ranged from 2.61 inches (Farm 2) to 9.71 inches (Farm 1) (Figure 7). Excluding the control farm, the average irrigation water applied was 7.0 inches, which was substantially higher as compared to the 2019 average of 0.94 inches.
