
Why Are Fewer Farmers Using Fallow?
Over the past 30 years, many dryland farmers throughout western Nebraska have replaced conventional tillage fallow with no-till chemical-fallow to improve water conservation practices under wheat-corn-fallow or wheat-fallow rotations. However, the sustainability of fallow is becoming a major challenge due to:
- weeds evolving resistance to herbicides and forcing farmers to use summer tillage for weed control;
- inefficient water use, soil degradation, and reduction in soil organic carbon (Blanco-Canqui et al., 2010);
- a decline in wheat market prices and expenses to maintain fallow weed-free; and
- an increase in expenses associated with state property taxes and cash rental rates for dryland cropland.
What are the Alternatives?
Switching to continuous corn or replacing fallow with shorter season crops such as soybean, field peas, chickpeas, or proso millet eliminates the expenses associated with the fallow period. Unlike fallow, each year crops are harvested for grain with the hope of generating an economic return. However, intensification of crop rotations often leads to less water being available to the subsequent crop in the rotation, often causing lower crop yield and reduced profit (Nelson et al., 2016).
The objective of this project was to compare fallow to field peas, chickpeas, and soybeans in terms of water balance, impact on next year’s wheat crop, and profitability.
Demonstration Plot
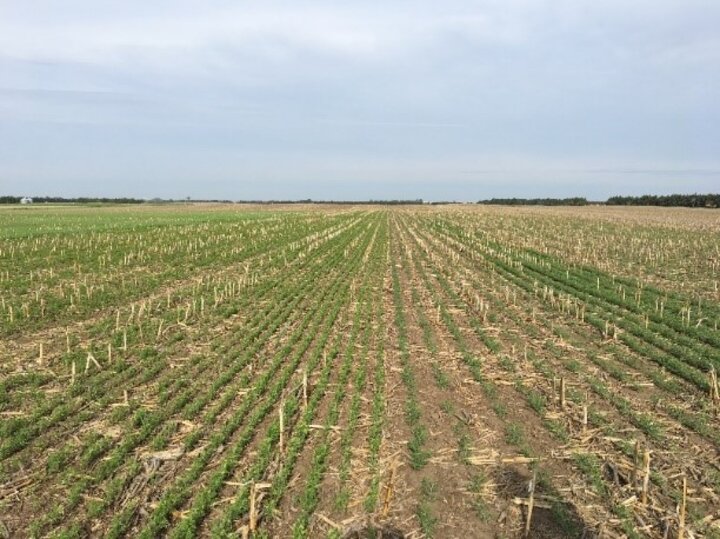
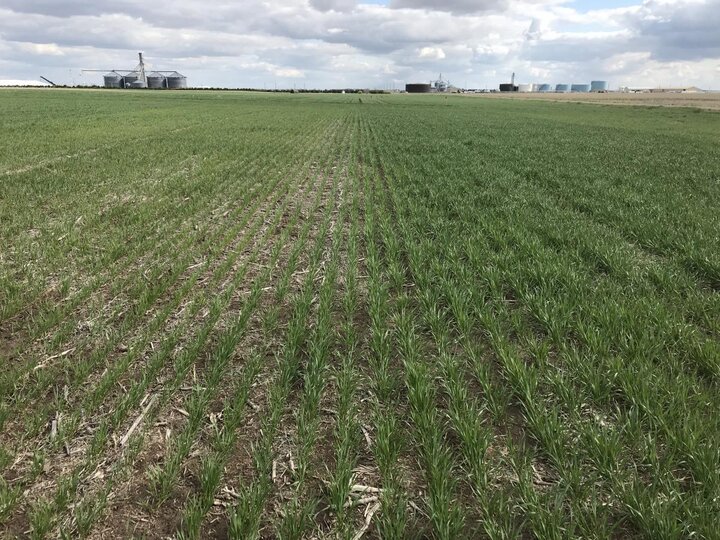
The demonstration plot was conducted at the Henry J. Stumpf International Wheat Research Center at Grant. The predominant soil type was Kuma silt loam and the previous crop was corn. The demonstration plot included a side-by-side comparison of field peas, chickpeas, soybeans, and fallow planted in 40-by-400 foot strips. Seeding dates for field peas, chickpeas, and soybeans were March 14, March 24, and May 17, respectively. Harvest was conducted on July 16, August 17, and October 23 for field peas, chickpeas, and soybeans, respectively. Other cultural and agronomic practices followed university recommendations. The winter wheat crop was planted on October 23 across all four strips, immediately following soybean harvest and harvested on July 20 the following year.
Water Balance
Soil water balance (DSW) is the difference in soil water profile at the beginning and end of the growing season. Water losses in fallow due to runoff (0.6 inches), deep percolation (11.5 inches), and evaporation (8.0 inches) were much greater compared to fallow replacements, resulting in a total of 20.1 inches of water loss (Table 1). However, fallow was also the only rotation that increased water storage in the soil profile (5 feet) by 1.9 inches over the course of the season (Table 1).
Deep percolation (DP). Substantial deep percolation losses were observed in all evaluated cropping systems due to above-average spring precipitation (6.5 inches higher than the 30-year average; Table 1). Among cropping systems, the largest deep percolation was observed in fallow (11 inches) followed by chickpeas, soybeans, and field peas which had 6.7, 6.0, and 5.0 inches, respectively. Growing field peas led to better utilization of spring precipitation and consequently, reduced water losses due to deep percolation.
Soil evaporative losses (ET). Fallow periods varied between the cropping systems, causing different patterns in soil evaporative losses. While field peas were able to efficiently use early season precipitation, the hot and dry post-harvest period (July 16 to October 23) led to 5.7 inches of evaporative losses. One month shorter post-harvest periods of chickpeas (August 17 to October 23) cut evaporative losses in the chickpea-wheat cropping system to 1.4 inches. Finally, the cooler pre-season fallow period of soybeans and no post-season fallow period resulted in no soil evaporative losses in soybeans.
Runoff (RO). All cropping systems had little runoff, due to good ground cover and relatively flat topography.
Crop water use efficiency (CWUE). Among the fallow replacements, field peas were the most water-use efficient crop, producing 30 bu/ac yield with 11.9 inches of water (2.5 bu/ac-inch). Next were chickpeas with a CWUE of 1.9 bu/ac-inch, followed by soybeans, which produced only 18 bu/ac using 18.6 inches of water (CWUE of 1.0 bu/ac-inch).
| Cropping System | Periods of Crop Growth/Fallow | 2018 Period | P (in) | RO (in) | DP (in) | ET (in) | DSW (in) | Wheat Yield (bu/ac) | CWUE (bu/ac-inch) |
|---|---|---|---|---|---|---|---|---|---|
| Field peas - Wheat | Crop growth | 03/14 to 7/16 | 15.7 | 0.0 | 3.3 | 11.9 | -1.4 | 30.0 | 2.5 |
| Fallow | 7/16 to 10/23 | 7.1 | 0.2 | 1.7 | 5.7 | ||||
| Total | 3/24 to 10/23 | 22.7 | 0.2 | 5.0 | 17.5 | ||||
| Chickpeas - Wheat | Crop growth | 03/24 to 8/17 | 19.8 | 0.0 | 4.9 | 15.5 | -1.6 | 30.0 | 1.9 |
| Fallow | 8/17 to 10/23 | 2.9 | 0.0 | 1.8 | 1.4 | ||||
| Total | 3/24 to 10/23 | 22.7 | 0.0 | 6.7 | 16.9 | ||||
| Soybeans - Wheat | Crop growth | 5/18 to 10/23 | 18.3 | 0.0 | 4.7 | 18.6 | -0.4 | 18.0 | 1.0 |
| Fallow | 3/14 to 5/18 | 4.4 | 0.0 | 1.3 | 0.0 | ||||
| Total | 3/24 to 10/23 | 22.7 | 0.0 | 6.0 | 18.6 | ||||
| Fallow - Wheat | Total | 3/24 to 10/23 | 22.7 | 0.6 | 11.5 | 8.0 | +1.9 |
Patterns in Soil Water Extractions
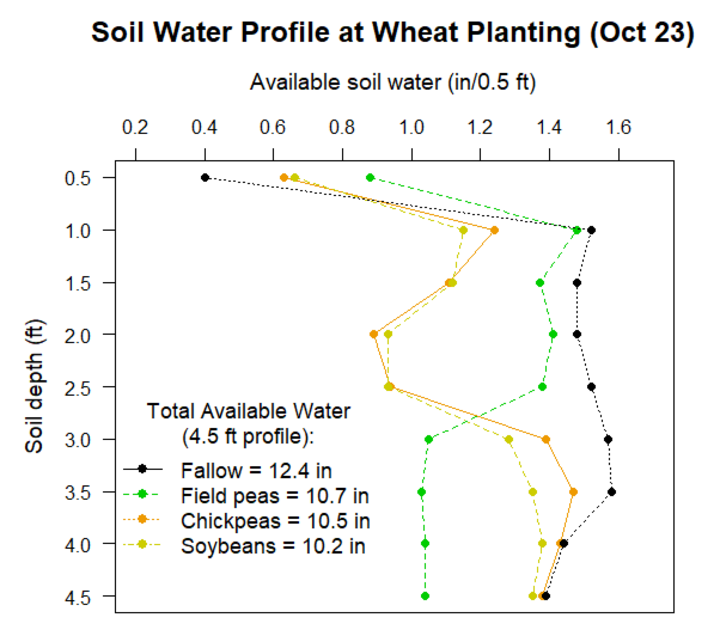
Although field peas, chickpeas, and soybeans had similar amounts of total available soil water at wheat planting (10.2-10.7 inches), the soil water extraction patterns were quite different between fallow replacements. Field peas used water from soil depths below 3 feet during the grain-fill period in June and July but allowed for greater precipitation storage in the top 3 feet during the three-month post-harvest period. Conversely, chickpeas and soybeans used most of the available water in the top 3 feet of the soil profile finishing off the crop during the summer, thereby not reaching for water at depths greater than 3 feet and not allowing enough time for precipitation storage in the topsoil. Soil water storage in fallow was greater than any fallow replacements, except in the top 6 inches of the soil where water retention was reduced due to lack of residue cover.
Effects on Next Year’s Wheat Crop

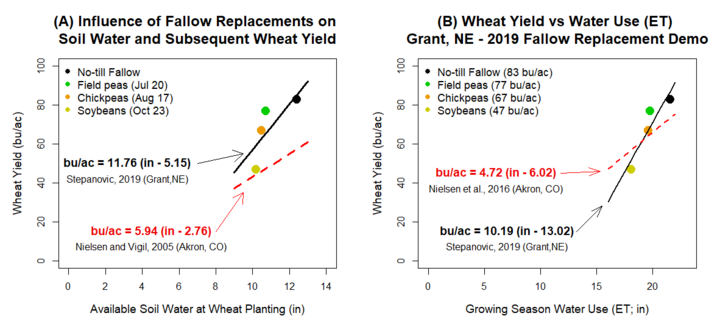
Compared to fallow, field peas, chickpeas, and soybeans had 1.7, 1.9 and 2.2 inches of soil water deficit causing yield penalties of 6, 16, and 36 bu/ac to the subsequent wheat crop, respectively (Figure 2). Figure 1 shows that an average yield penalty of 11.76 bu/ac occurred per inch of reduced water at wheat planting (slope of the regression line), which is a much higher yield penalty than the 5.94 bu/ac per inch reported in a cover crop termination timing study near Akron, Colorado. Nielsen and Vigil (2005) found that delaying cover crop termination from June 12 to July 13 (32 days) caused an additional 12 bu/ac wheat yield reduction. In our study, a similar trend occurred as time between harvest of field peas (July 20; 99 days), chickpeas (Aug 17; 67 days) and soybeans (Oct 23; 0 days) and planting of wheat (Oct 23) was narrowed, causing severe yield reduction in wheat planted behind soybean.
The slope of the water use versus yield relationship at Grant (10.19 bu/ac per inch) was higher than that found in the Akron, Colorado research (4.72 bu/ac per inch). All previous research conducted in the High Plans region has shown that wheat is not an efficient water user, suggesting that factors other than available water may have influenced subsequent wheat yield (Nielsen et al., 2016; Stone and Schlegel, 2006). The relationship of yield versus water use in the Nebraska demonstration plot may, therefore, be exaggerated by low yielding wheat planted after soybean (point below the trend line). We suspect lower levels of phosphorus in the soil may have caused severe wheat yield reduction behind soybeans. There were no other notable differences between rotations in physical, chemical, or biological characteristics (soil health assessment test) of the soil as well as chemical analysis of tissue samples.

Figure 3. (A) Influence of fallow, field peas, chickpeas and soybeans on the available soil water at wheat planting and subsequent wheat yield; (B) Water use (ET) and yield of wheat planted behind fallow, field peas, chickpeas, and soybeans; black line is data from 2018/19 demonstration plot near Grant; red line is a published relationship from studies conducted at Akron, Colorado (Nielsen and Vigil, 2016; Nielsen et al., 2016).
|
Rotation |
2018 - Year 1 (prior to 10/23/2018) |
2019 - Year 2 (10/23/18 to 07/20/2019) |
||||
| Production* cost ($/ac) | Yield (bu/ac) | Grain prices ($/ac) | Wheat Yield (bu/ac) | Wheat grain protein (%) | Profitability ($/ac) † |
|
| Fallow - Wheat | 67 | 0 | 0.0 | 83 | 11.4 | 27 |
| Field peas - Wheat | 192 | 30 | 6.5 | 77 | 10.5 | 66 |
| Chickpeas - Wheat | 227 | 30 | 6.8 | 67 | 9.7 | 2 |
| Soybeans - Wheat | 232 | 18 | 9.2 | 47 | 9.7 | -118 |
| * Production cost includes expenses for seed, inoculant, herbicides, fungicides, planting, and spraying, harvest, trucking, and land charge. Production costs may differ from year to year and from producer to producer. † Wheat production cost of $232/ac and wheat grain price of $3.8/bu were included in profitability calculation |
||||||
Which Rotation Is The Most Profitable?
The field peas-wheat rotation was the most profitable in this two-year demonstration project. Factors influencing the outcome include growing season conditions, farm management, production cost, etc. However, we found grain marketing and market price to be the most significant factor influencing short-term profitability. For example, we did not market chickpeas, thus the low market price reported in Table 2 was influenced by a market crash and low seed quality at the time grain was delivered to the elevator. We also found that an increase in the price of wheat makes a more compelling case for fallow.
One clear message is that replacing fallow with soybean will most likely result in economic loss. Soybean yield potential greatly depends on getting rains in August, a normally dry month in western Nebraska. The large penalty on subsequent wheat yield cannot be ignored either. Based on this study, at current soybean prices, soybean yield would have to be 31-38 bu/ac in the first year of rotation to be as profitable as fallow-wheat, field peas-wheat, or chickpeas-wheat rotations.
References
Blanco-Canqui, H., L.R. Stone, and P.W. Stahlman. 2010. Soil response to long-term cropping systems on an Argiustoll in the central Great Plains. Soil Science Society of America Journal, 74:602–611. doi:10.2136/sssaj2009.0214
Nielsen, D.C., and M.F. Vigil. 2005. Legume green fallow effect on soil water content at wheat planting and wheat yield. Agronomy Journal, 97:684-689. doi:10.2134/agronj2004.0071
Nielsen, D.C., D.J. Lyon, R.K. Higgins, G.W. Hergert, J.D. Holman, and M.F. Vigil. 2016. Cover crop effect on subsequent wheat yield in the Central Great Plains. Agronomy Journal, 108:243–256. doi:10.2134/agronj2015.0372
Stone, L.R., Schlegel, A.J. 2006. Yield-water supply relationships of grain sorghum and winter wheat. Agronomy Journal, 98: 1359-1366
Nebraska Extension Crop Production Budgets, Department of Agricultural Economics.
