Things you will find out:
- More about USDA’s National Agricultural Statistics Service (USDA-NASS) and their data tools
- It felt like one of the most extended planting seasons on record, but was it?
- Nebraska versus Illinois 2019 data comparison. Will it make you feel better?
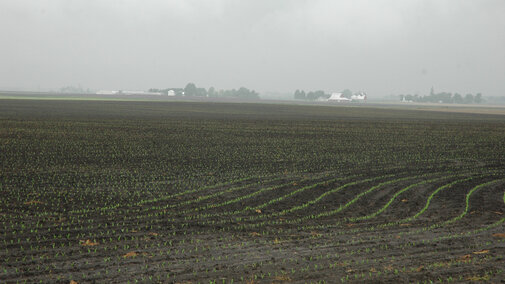
A road trip last weekend east across Iowa and into north-central Illinois on Interstate 80 provided visual reinforcement of what we’ve been hearing: Corn doesn’t look good back east. In nearly 40 years of driving that route, I don’t recall seeing the crop appearing worse than it does this year. Corn ranged from not planted to spiking (just emerging) to close to V8 (eighth-collar stage). Canopy colors of even the early-planted fields ranged from dark green to yellow. Ponds blemished planted and unplanted fields. Overall Nebraska’s fields don’t look fantastic, but in comparison they look great – nevertheless, we have many issues too!
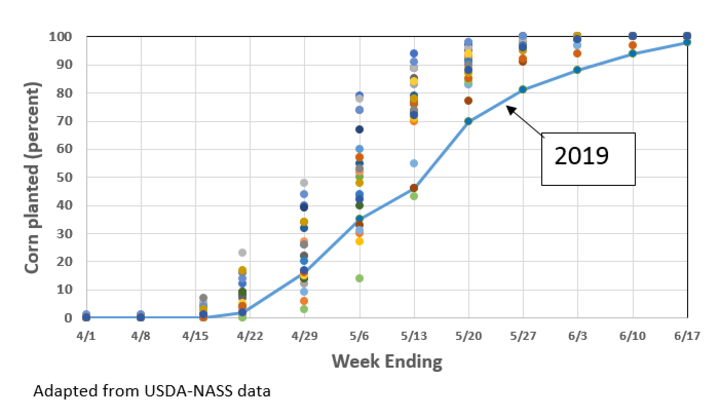
Since 98% of our corn is planted, according to the United States Department of Agriculture National Agricultural Statistics Service (USDA-NASS) report for Nebraska, it’s a good time to reflect on what has been one of the most extended planting seasons on record. Figure 1, displays Nebraska’s corn planting progress from 1996 to 2019. The lower values for planting progress for April 29 and May 6 were from 2013. This year’s planting progress after mid-May was the slowest in the last 24 years.
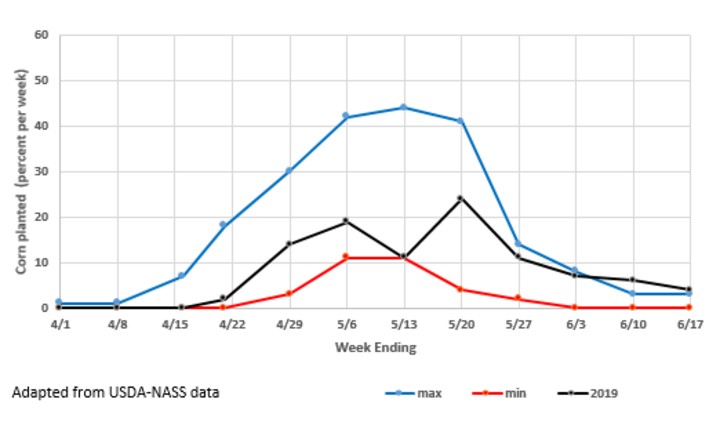
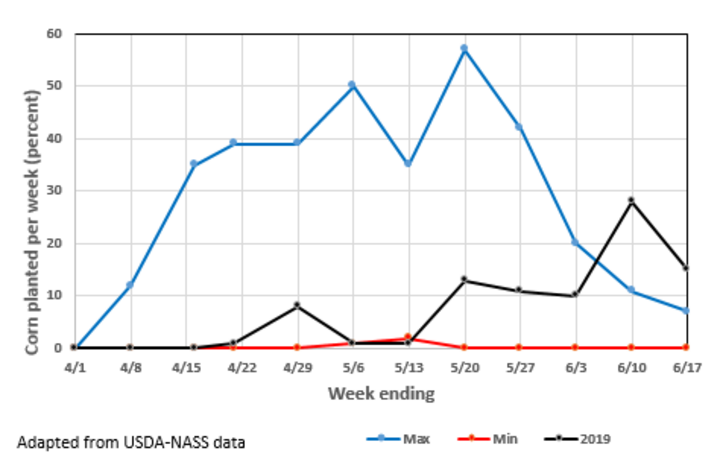
Figure 2 displays another way to look at the same data. It shows the percentage of Nebraska’s corn planted on a weekly basis (from Quick Stats, USDA-NASS) compared to the minimum and maximum percentage planted in the same week in previous years (1996 to 2019). Our planting progress in late April and early May 2013 was especially slow – 41% of our crop was planted in seven days – the week ending May 20, 2013. On the best week of this year, 2019, we were able to plant 24% of our crop, but that wasn’t until the week ending May 20.
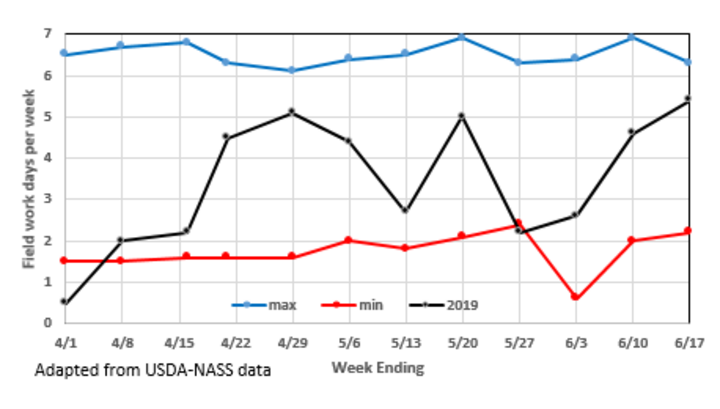
Fieldwork days are also summarized by USDA-NASS Nebraska and accessible with Quick Stats. Figure 3 summarizes these data for 2019 compared to years when we had both the maximum and the minimum fieldwork days per week from late April through mid-June. Fieldwork days per week in late April though late May track similar to our planting progress. It appears that we took advantage of days where planting was possible. However, many acres were seeded under higher soil moisture conditions than desired when planting.

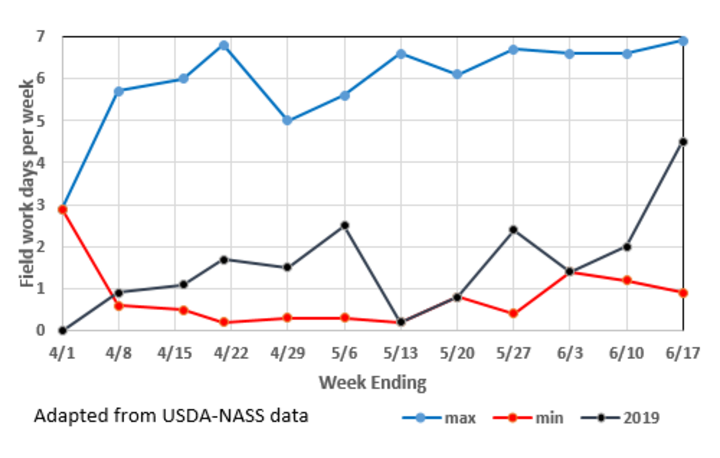
Note: USDA-NASS fieldwork data was available beginning in 1996 for Nebraska, and 1997 for Illinois.
For comparison purposes, and perhaps to help Nebraska farmers feel a bit better, Figures 4, 5, and 6 display the same chart layouts for Illinois data as Figures 1, 2, and 3 do for Nebraska (from USDA Quick Stats). In Illinois, the other year with similar slow planting progress to that of 2019 was 2009, at least through May 20. Sixty-two percent of Illinois’s crop was planted at the week ending May 27, 2009. This year one-half of Illinois’s corn wasn’t planted until the week ending June 10. As of last Sunday, June 16, 12% remained unplanted in Illinois. Thinking about delayed planting and yield potential, it’s interesting that even with the slow progress of planting in Illinois in 2009, final Illinois yields (estimated by USDA-NASS) were above the 1997 – 2018 trend line.
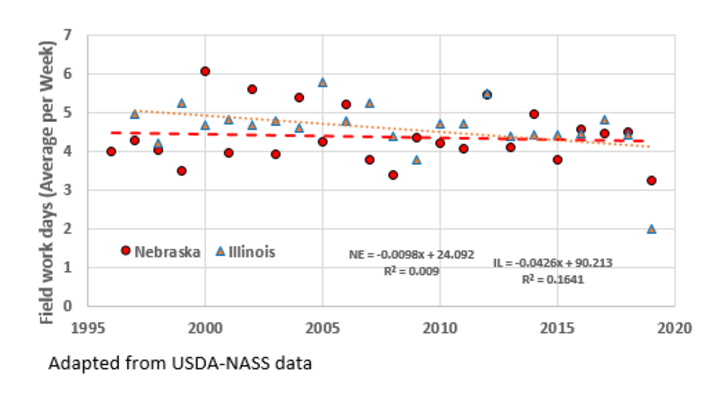
One more way to look at these data is to compare fieldwork days over the years for both states (Figure 7). Although both trend lines have negative slopes, suggesting fieldwork days are fewer more recently, 2019 data skew the slopes dramatically.
Even though 78% of Nebraska corn in mid-June was in the good to excellent condition category, according to the last USDA-NASS Nebraska report, Nebraska’s planting progress was near record lows. Fieldwork days helps explain the year-to-year variation in planting progress.
Keep in mind that…
- these are statewide data and
- the season has barely started.
A lot can happen from now until the combines roll this fall.
View data from USDA-NASS for yourself:
Acknowledgement: Thanks to Jenny Rees and Nathan Mueller for their thoughtful reviews of this article.
