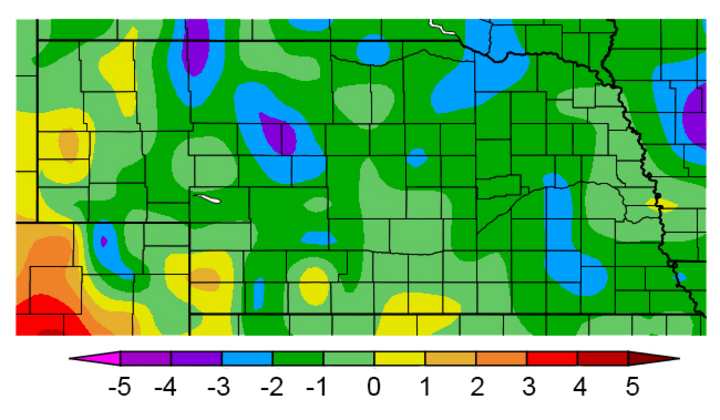
Above normal temperatures during August (Figure 1) in areas of the Panhandle and southwest Nebraska significantly reduced the freeze risk for timely and late-planted corn. Temperatures across the Panhandle averaged from 2 degrees (F) to 2 degrees above normal. Temperatures across the central third of the state ranged from 1 to 4 degrees below normal, which resulted in an increased freeze risk as compared to what was indicated in the early August freeze risk report.
Because temperatures across the Panhandle were close to or above normal during August, GDD accumulations were also above normal, especially during the second half of the month. When comparing current conditions to our base normal period (1981-2010) and applying the base normal period to this year’s GDD accumulations for the four emergence dates listed in Table 1, corn that emerged from May 27 to June 10 now has less than a 50% freeze risk compared to the normal period for varieties of 2500 GDDs or less.
The latest GDD freeze risk summary indicates that corn varieties listed as maturing at 2500 GDDs or less and which emerged June 10 may fail to reach maturity 60%-100% of the time across the northern third of the state east of the Panhandle. For corn that emerged on May 27, 2500 GDD varieties would carry less than a 50% risk of freeze damage compared to the 1981-2010 period; 2700 GDD varieties would have a greater than 80% likelihood of not reaching maturity.
What these statistics tell us is this September needs to be warmer than any September in the comparison period of 1981-2010 to reduce the freeze risk below 50% for corn emerged in late May and early June. Thus, the temperatures over the next four weeks will ultimately dictate whether late-planted crops escape significant freeze damage.
Models Indicate Above Normal Temperatures
The latest GFS model run released Wednesday morning, September 11 indicates that the warm temperatures experienced this week will likely continue for the next week as another upper air trough digs into the western U.S. This trough is projected to slowly traverse eastward, with the trough forecasted to impact the central third of the country as early as Monday, September 16, pushing above normal temperatures into the eastern half of the country ahead of the slowly advancing trough.
If the models are correct, most of next week will feature daily rounds of thunderstorm activity across the central Plains as this deep trough lifts Gulf of Mexico moisture northward to interact with surface lows that eject out of the western U.S. trough. By next weekend (September 14-15), the GFS model places the upper air low across eastern Nebraska, then lifts it into the Great Lakes region by September 16.
Unfortunately, the northern third of the state, the Dakota’s, Minnesota, and northern Iowa will likely see excessive moisture. If that is not bad enough, the departing upper air low is forecasted to merge with the upper air trough over the Hudson Bay. The GFS model intensifies the Hudson Bay upper air trough and pulls freezing temperatures southward into the northern Plains and upper Midwest (Dakota’s, Minnesota, Wisconsin, and Michigan) between September 28 and October 1.
If the GFS model does verify, much of the area of the western Corn Belt north of I-94 ― an area that had extensive planting delays ― would be impacted. It is entirely possible that the GFS is overplaying the extent of cold air that will be pulled southward into the northern Plains, but this pattern bears watching. If we can escape this forecasted event, it will likely take an additional week or longer for the next surge of cold air to enter the continental U.S.
| AVG. FREEZE | EMERGENCE: 4/29 | EMERGENCE: 5/13 | |||||||||
|---|---|---|---|---|---|---|---|---|---|---|---|
| LOCATION | Date | 1900 | 2100 | 2300 | 2500 | 2700 | 1900 | 2100 | 2300 | 2500 | 2700 |
| Scottsbluff | 5-Oct | 0 | 0 | 0 | 50 | 100 | 0 | 0 | 0 | 57 | 100 |
| Ord | 10-Oct | 0 | 0 | 0 | 0 | 63 | 0 | 0 | 0 | 0 | 70 |
| O’Neill | 13-Oct | 0 | 0 | 0 | 17 | 100 | 0 | 0 | 0 | 60 | 100 |
| Concord | 11-Oct | 0 | 0 | 0 | 0 | 10 | 0 | 0 | 0 | 0 | 13 |
| Sidney | 11-Oct | 0 | 0 | 37 | 93 | 100 | 0 | 0 | 53 | 100 | 100 |
| North Platte | 12-Oct | 0 | 0 | 0 | 0 | 43 | 0 | 0 | 0 | 0 | 57 |
| York | 20-Oct | 0 | 0 | 0 | 0 | 0 | 0 | 0 | 0 | 0 | 0 |
| West Point | 14-Oct | 0 | 0 | 0 | 0 | 6 | 0 | 0 | 0 | 0 | 7 |
| McCook | 18-Oct | 0 | 0 | 0 | 0 | 0 | 0 | 0 | 0 | 0 | 0 |
| Red Cloud | 12-Oct | 0 | 0 | 0 | 0 | 0 | 0 | 0 | 0 | 0 | 0 |
| Beatrice | 21-Oct | 0 | 0 | 0 | 0 | 0 | 0 | 0 | 0 | 0 | 0 |
| AVG. FREEZE | EMERGENCE: 5/27 | EMERGENCE: 6/10 | |||||||||
| LOCATION | Date | 1900 | 2100 | 2300 | 2500 | 2700 | 1900 | 2100 | 2300 | 2500 | 2700 |
| Scottsbluff | 5-Oct | 0 | 0 | 10 | 83 | 100 | 0 | 3 | 67 | 100 | 100 |
| Ord | 10-Oct | 0 | 0 | 0 | 40 | 100 | 0 | 0 | 63 | 100 | 100 |
| O’Neill | 13-Oct | 0 | 0 | 30 | 90 | 100 | 0 | 37 | 93 | 100 | 100 |
| Concord | 11-Oct | 0 | 0 | 0 | 10 | 73 | 0 | 0 | 17 | 93 | 100 |
| Sidney | 11-Oct | 0 | 7 | 80 | 100 | 100 | 0 | 70 | 100 | 100 | 100 |
| North Platte | 12-Oct | 0 | 0 | 0 | 20 | 87 | 0 | 0 | 33 | 97 | 100 |
| York | 20-Oct | 0 | 0 | 0 | 0 | 43 | 0 | 0 | 0 | 60 | 100 |
| West Point | 14-Oct | 0 | 0 | 0 | 6 | 80 | 0 | 0 | 10 | 90 | 100 |
| McCook | 18-Oct | 0 | 0 | 0 | 0 | 48 | 0 | 0 | 0 | 13 | 77 |
| Red Cloud | 12-Oct | 0 | 0 | 0 | 0 | 10 | 0 | 0 | 0 | 47 | 97 |
| Beatrice | 21-Oct | 0 | 0 | 0 | 0 | 17 | 0 | 0 | 0 | 27 | 83 |
Average First Fall Hard Freeze (28°F or less)
(Dates were acquired using Useful to Useable GDD Calculator tool.)
The Emergence Date Freeze Occurrence values in Table 1 are derived by using the 30-year normals period (1981-2010) to determine the percentage of time that a freeze occurred before GDD accumulations reached the defined threshold. This was done by determining the GDDs accumulated in 2019 from the listed emergence dates and adding the listed GDDs from August 1 through the average hard freeze date for the 1981-2010 period.
Black numerals signal that 50% or less of the time a freeze would occur. Red signals that freeze criteria was above 50% of the time, with the value listed given the percent of time the event would occur using 2019 data and applying 1981-2010 accumulation to the remaining growing season. Data was provided by the High Plains Climate Center's Applied Climate Information Service.
This table separates the state into three distinct zones: the northern, central, and southern thirds of the state. Stations selected run from west to east for each zone.
