With relatively low market prices and little farm program support expected in 2019, producers will need to carefully manage their risk portfolio, including farm programs, production costs, insurance, and marketing.
The USDA Farm Service Agency (FSA) began issuing payments to producers in October for Price Loss Coverage (PLC) and Agriculture Risk Coverage (ARC) programs for the 2017 crop year. While the farm program payments had provided substantial cash flow to help buffer falling market price and farm income projections in the past three years, the programs are providing relatively little cash flow for now and for the coming year. Only the ad hoc trade assistance payments and the outlook for new farm programs and decisions in 2019 provide potential relief from the current outlook.
Farm Program Payments
An analysis of farm program payment rates provides details on the current payments as well as the outlook for future support. The federal farm program support comes from commodity programs created in the 2014 farm bill. The legislation gave producers a choice of enrollment by commodity and by county in either a price-based program (PLC) or a revenue-based program (ARC) at either the county level (ARC-CO) or the farm level (ARC-IC for “individual coverage”). As commodity prices declined from pre-2014 levels, both ARC and PLC have become important components of the farm income safety net, providing substantial infusions of cash flow for producers.
Table 1 provides historic national marketing year average prices and current national marketing year price projections for the primary Nebraska crops for the 2014-2018 crop marketing years, the years covered by the 2014 farm bill programs. National marketing year average prices are used to calculate potential PLC payments and ARC payments. ARC-CO payments are also dependent on county yields while ARC-IC payments are dependent on individual farm-level yields.
The multi-year decline in prices has translated into substantial farm program payments and projected payments. However, the differing objectives and mechanics of ARC and PLC create very different payment levels and projections.
| Commodity | Reference Prices ($/bushel) | Prices ($/bushel) | ||||
|---|---|---|---|---|---|---|
| 2014 | 2015 | 2016 | 2017 | 2018 | ||
| Corn | 3.70 | 3.70 | 3.61 | 3.36 | 3.36 | 3.50 |
| Grain Sorghum | 3.95 | 4.03 | 3.31 | 2.79 | 3.22 | 3.30 |
| Soybeans | 8.40 | 10.10 | 8.95 | 9.47 | 9.33 | 8.60 |
| Wheat | 5.50 | 5.99 | 4.89 | 3.89 | 4.72 | 5.10 |
| *Final price estimates for 2014-2017 from USDA-NASS. Price projections for 2018 from USDA-WAOB and USDA-FSA as of October 2018. (Sources: USDA-FSA, USDA-NASS, and USDA-WAOB) | ||||||
| Commodity | Average PLC Payment Yield (bu/ac) | Average PLC Payment Rates per Base Acre ($/base acre) | ||||
|---|---|---|---|---|---|---|
| 2014 | 2015 | 2016 | 2017 | 2018 | ||
| Corn | 150 | 0.00 | 11.47 | 43.31 | 43.31 | 25.48 |
| Grain Sorghum | 77 | 0.00 | 41.95 | 76.04 | 47.85 | 42.61 |
| Soybeans | 45 | 0.00 | 0.00 | 0.00 | 0.00 | 0.00 |
| Wheat | 41 | 0.00 | 21.19 | 55.93 | 27.09 | 13.89 |
| *PLC payments and payment projections based on weighted average PLC payment yields in Nebraska. Payments based on prices for 2014-2017 from USDA-NASS and price projections for 2018 from USDA-WAOB and USDA-FSA as of October 2018. Sources: USDA-FSA, USDA-NASS, and USDA-WAOB. | ||||||
| Commodity | County/Practice Combinations | Average ARC-CO Payment Rates per Base Acre ($/base acre) | ||||
|---|---|---|---|---|---|---|
| 2014 | 2015 | 2016 | 2017 | 2018 | ||
| Corn | 131 | 53.31 | 52.36 | 52.89 | 5.31 | 0 |
| Grain Sorghum | 103 | 18.44 | 21.54 | 29.25 | 14.94 | 0 |
| Soybeans | 112 | 15.47 | 28.45 | 5.6 | 6.61 | 0 |
| Wheat | 112 | 9.11 | 24.3 | 8.26 | 5.55 | 0 |
| *ARC-CO payments and payment projections averaged across all counties and practices in Nebraska where data is available. Payments for 2014-2017 from USDA-FSA. Payment projections for 2018 based on yield and price projections from USDA-NASS, USDA-WAOB, and USDA-FSA as of October 2018. Sources: USDA-FSA, USDA-NASS, and USDA-WAOB. | ||||||
PLC payment rates are directly tied to the difference between the legislated reference price and the national marketing year average price for each commodity, with a maximum payment rate equal to the difference between the reference price and the national average marketing loan rate. Table 1 also provides the reference price for each major commodity to allow comparisons of market prices and reference prices. PLC payment rates per base acre for each crop are based on the calculated payment rate multiplied by the producer’s program yield and 85% of the producer’s base acreage. The total payment is limited by producer payment limit and eligibility rules and is reduced according to the rules of budget sequestration.
PLC payments were negligible in Nebraska for the 2014 crop year, but payment rates have become substantial as prices for wheat, grain sorghum, and corn dropped below reference price levels. Using average program yields across the state, Table 2 presents average PLC payment rates per base acre for the 2014-2018 crop years, based on official FSA data through the 2017crop year and current price projections as noted in the table for the 2018 crop years.
While producers with base acres of wheat, grain sorghum and some minor crops enrolled a substantial portion of the acreage in PLC, corn and soybean base acres were overwhelmingly enrolled in the ARC program, given the projections of substantially more support from ARC at the time for those crops.
Thus, even though PLC payment rates have increased with lower price levels, the total amount of PLC payments in Nebraska this year remains relatively small at about $53 million for the 2017 crop. Looking forward to the 2018 crop payments to be made in October 2019, the projections are even smaller at about $35 million due to the projected modest recovery in corn and wheat prices.
While PLC payment rates have grown over the life of the 2014 farm bill, ARC payment rates have fallen dramatically. Unlike PLC payments that are tied to a fixed reference price set in legislation, ARC-CO payments are tied to revenue (price times yield) results for the crop year compared to a benchmark revenue based on the five-year Olympic average price and yield for each crop by county and by practice for those crops where county-level irrigated and non-irrigated yields are calculated separately. ARC-IC is calculated similarly, but on farm-level yield averages and results. The ARC program protects producers when revenue drops below a guarantee equal to 86% of the benchmark revenue based on the average prices and yields.
ARC payments are based on the same national marketing year average prices that are used with PLC. ARC-CO payments are additionally based on county-level crop yields as estimated from USDA National Agricultural Statistics Service (NASS) data where available or from USDA Risk Management Agency (RMA) data or other procedures as necessary. Yields per harvested acre are adjusted by FSA for unharvested acreage to generate yields per planted acre used in the ARC formula. ARC-IC payments are based on actual farm-level yields per planted acre and add to total ARC payments, but are an insignificant part of the total payment amounts due to limited enrollment.
Table 3 shows the average ARC-CO payment rates per base acre for the 2014-2017 crop years for major Nebraska crops along with projections for the 2018 crop year. As with PLC, the total payment is limited by producer payment limit and eligibility rules and is reduced according to the rules of budget sequestration.
The payment rates in Table 3 were calculated per base acre, taking into account that payments are made on only 85% of base acres. The payment rates also represent a simple average of all calculated payment rates in Nebraska for each crop, including all irrigated, non-irrigated, and blended practices by county. Thus, the rates do not reflect any single payment rate and do not illustrate the wide variability in payment rates due to variable yield results, but they do demonstrate the general level of payments for each crop over the life of the 2014 farm bill.
While ARC payment rates were large in the first years of the 2014 farm bill, the payment rates and projections have fallen dramatically as lower market prices led to lower five-year Olympic average prices and thus, lower ARC guarantees. Total ARC payments in Nebraska exceeded $600 million on each of the 2014 and 2015 crops and $550 million on the 2016 crop, but are now projected at just $80 million on the 2017 crop and nothing on the 2018 crop, based on current price and yield forecasts.
Detailed payment estimates and analyses are available on the Nebraska Extension Farm Bill website at http://farmbill.unl.edu. Full tables of all counties, crops, and practices under the ARC-CO program in Nebraska are posted online for the 2014-2017 crop years along with current projections for the 2018 crop year. The data is regularly updated as new price, yield, and/or program information is available.
Farm Program Prospects
The decline in farm program payments and support even as market prices are slow to recover will stress farm income and cash flow projections through 2019. However, Market Facilitation Program (MFP) payments made as part of the trade assistance announced earlier this fall by the Secretary of Agriculture, will provide some temporary relief from the declining cash flow. As discussed by Giri, Peterson, and Sharma in a recent Cornhusker Economics article, the payments were announced for crop and livestock commodities most directly impacted by market losses as a result of the on-going trade conflict with China.
Based on current production estimates and announced payment rates, total MFP payments could exceed $320 million in Nebraska, offsetting a large share of the simultaneous decline in ARC payments. While that will help cash flow projections in 2018, the expectation of little combined ARC and PLC payments in 2019 (on the 2018 crop) will keep cash flow prospects dim, barring a substantial market rebound or additional assistance from USDA.
While producers need to manage for the reduced farm program supports over the coming year, they also need to be ready for new farm program decisions in the coming year. The 2014 farm bill expired at the end of September without either a new farm bill or an extension of current programs in place. While negotiators from both the Senate and the House were continuing to work through differences in legislative proposals from both chambers, the outlook for the 2018 farm bill remained cloudy as of late October. If a compromise is reached, it could be voted on in a lame duck session of Congress after the November election. If consensus couldn’t be achieved, the fallback is likely a vote to extend current legislation from the 2014 farm bill for a year and begin the farm bill debate again in a new session of Congress.
With the current uncertainty, the primary question ahead for crop producers may not be whether Congress passes a new farm bill or extends current legislation, but whether to sign up for ARC or PLC in 2019 under new or extended programs. While the 2018 farm bill proposals from the Senate and the House contain several competing policy ideas, they both suggest the continuation of the current ARC and PLC programs. Even with potential changes to the programs, the biggest change for producers could be having a new ARC vs. PLC decision in 2019 under very different price conditions than when the decision was last made in 2014.
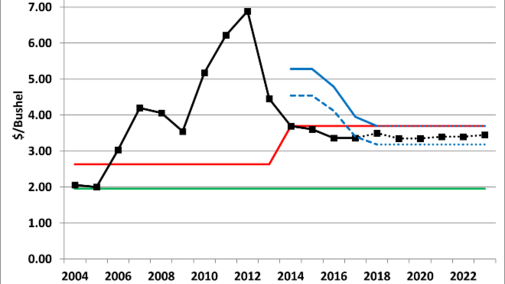
Figures 1-4 show market prices and projections against the price-based support of the PLC program and the price component of the revenue-based ARC program through 2023, the presumed end of the next farm bill. The price projections for 2018 are from October USDA reports while the price projections for 2019-2023 are from baseline USDA projections released in February (before current trade conflicts spiked).
In each graph, the PLC reference price set in the 2014 farm bill is projected to continue as is under new or extended legislation and provide income support to producers if market prices are below reference rate levels. The price component of the ARC protection is the moving five-year Olympic average price. Based on historic and projected prices from USDA as of October 2018, the average price has been falling for all commodities and has effectively bottomed out at the reference price (the minimum price to count for each year of the average under ARC program rules) for major commodities other than soybeans.
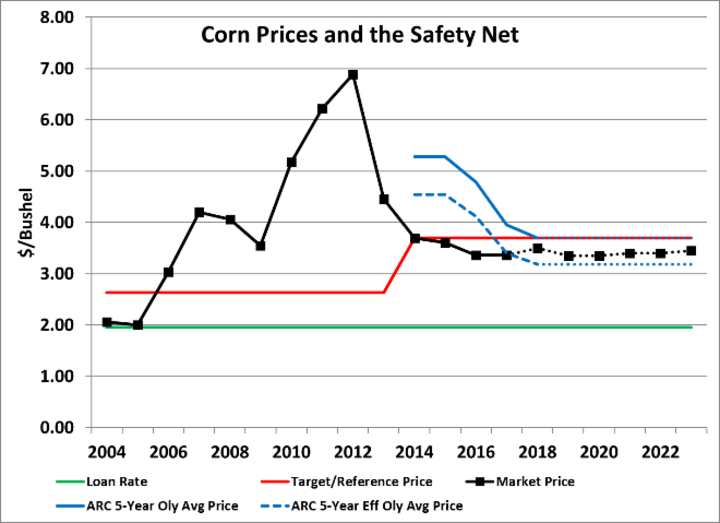
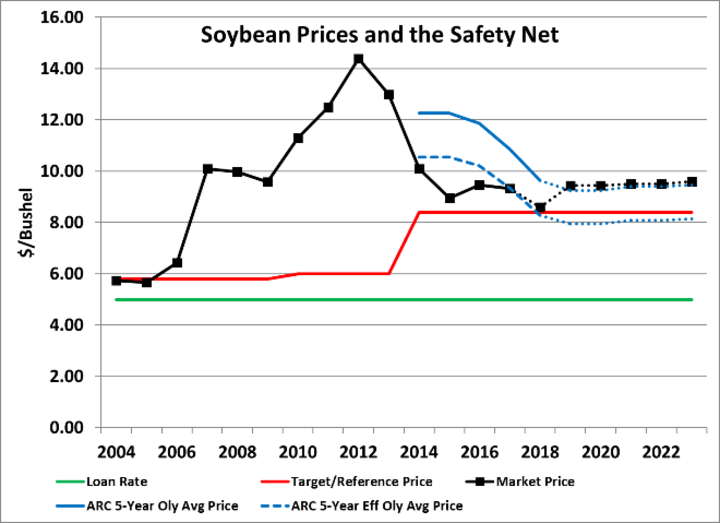
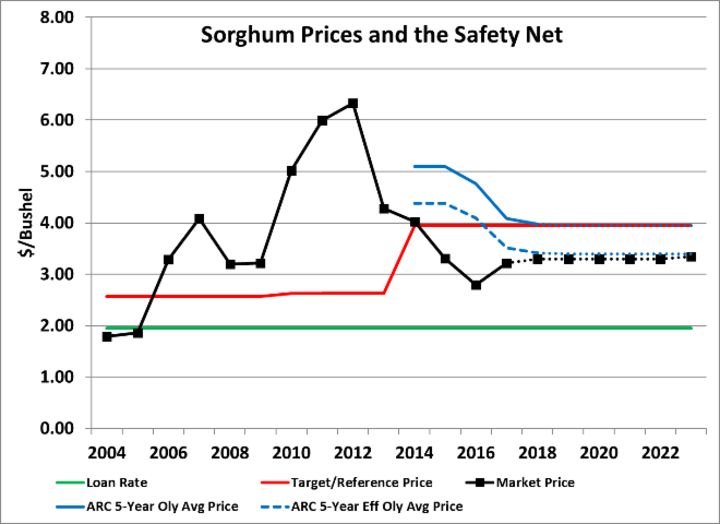
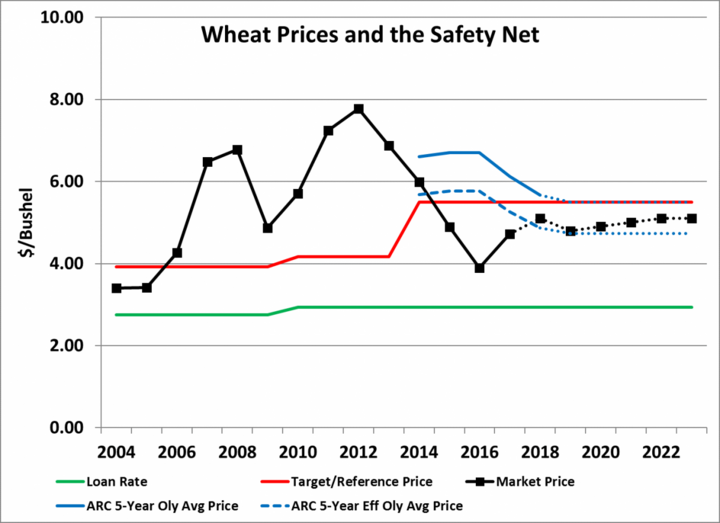
* Prices and price projections as of October 2018 from USDA-FSA, USDA-NASS, and USDA-WAOB. ARC five-year effective Olympic average price based on 86% of ARC five-year Olympic average price for illustration only as ARC protection is tied to revenue.
While the average price will bottom out at the reference price, the ARC guarantee is 86% of the average yield and average price. Thus, the effective price protection starts at 86% of the moving average price, assuming average yields (more price protection under lower yields, less price protection under higher yields). Using that as a baseline for comparison, the effective price protection (assuming average yields) offered by ARC in 2019 and beyond will fall below that provided by PLC for all major commodities assuming current projections of only modest price recovery. While ARC will provide revenue support due to low yields that PLC will not provide, the economics of the two programs are definitely different than when the ARC vs. PLC decision was first made in 2014.
Summary
In sum, farm program payments have helped Nebraska crop producers cope with the dramatic drop in prices since 2013 with $500-$600 million plus in payments received on each of the 2014-2016 crops. But that support, largely in ARC, is quickly disappearing as prices continue at lower levels, with payments falling to around $100 million or less for the 2017-2018 crop, buffered only temporarily by the $300 million plus in trade assistance payments this fall. Barring significant market recovery or further trade assistance, producers will be managing for relatively low market prices and relatively little farm program support in 2019. A new farm program decision in 2019 could provide additional payments in 2020, but regardless, producers will need to manage their risk carefully, including not just farm programs, but also production, insurance, and marketing decisions that all contribute to a portfolio approach to risk management.
Updated information, detail, and analysis is available at http://farmbill.unl.edu.
Material From:
Lubben, B. “Farm Programs, Payments, and Prospects.” Cornhusker Economics, October 21, 2018.
Reference
Giri, A., W. Peterson, and S. Sharma. “Market Facilitation Program: Impact on Nebraska Corn and Soybean Producers.” Cornhusker Economics, October 3, 2018.
