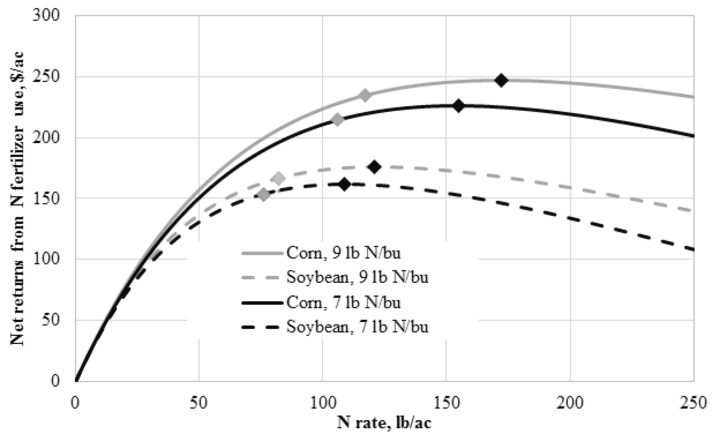
Nitrogen losses to the environment are related to fertilizer N rate. The UNL N rate recommendations are intended to maximize profit per acre from fertilizer N use or to apply at the economically optimal N rate (EONR). However, we see that the changes in yield due to N rate are small near EONR and applying a few pounds of N/ac more or less than EONR has little effect on grain yield. (See Figure 1; determined from the results of 12 trials for corn following corn and 18 trials for corn following soybean and for $4/bu of grain and $0.44/lb fertilizer N.) Small changes in N rate have much less effect on the marginal profit due to fertilizer N use than on grain yield. (See Figure 2; costs of $0.44/lb and 0.57/lb of fertilizer N are compared.)
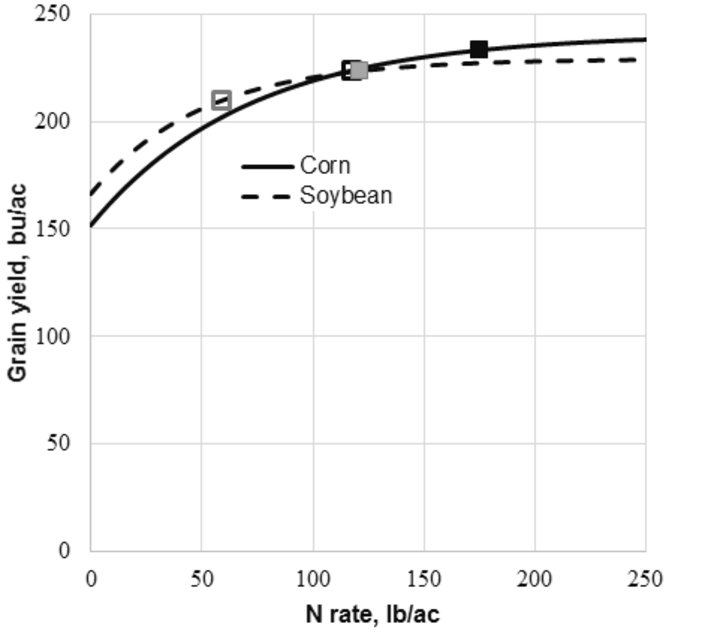
Figure 1. Irrigated corn yield response to fertilizer N averaged over 12 trials for corn following corn and 18 trials for corn following soybean. The black squares are for corn following corn and the gray squares are for corn following soybean. The solid squares are for N applied at the economically optimal N rate and the open squares are for the N rate resulting in 5% less marginal profit to fertilizer N use.
This raises the question as to how N losses might be reduced with a reduction in N rate that results in 5% less marginal profit to fertilizer N use. The objective of this article is to address this particularly for greenhouse gas emission expressed in carbon dioxide equivalents (CO2e). The practice would have effects on other N losses, and especially due to leaching, but these are much more highly variable across Nebraska croplands than is the case for nitrous oxide (NO2) and CO2 emission associated with fertilizer N use.
Table 1 gives a comparison, averaged across two fertilizer N costs, for fertilizer N applied at EONR and applied at a rate that results in 5% less marginal profit due to fertilizer N use. The mean reductions in N rates are 51 lb N/ac and 31% for corn following corn and 36 lb N/ac and 31% for corn following soybean. This results in mean reductions in grain yield and marginal profits to fertilizer N use of 9.1 bu/ac and $11.76 for corn following corn and 6.0 bu/ac and $8.40 for corn following soybean.
The mean corresponding effects on CO2e due to N2O emissions plus CO2 emissions associated with fertilizer N use are estimated to be reductions of 189 plus 143 for a total 332 lb CO2e/ac for corn following corn and 133 plus 101 for a total 234 lb CO2e/ac for corn following soybean. The costs to achieve these reductions are the loss in marginal profit due to fertilizer N use. Therefore, the costs per ton of CO2e reduction are $71.11 for corn following corn and $71.95 for corn following soybean if no credit is given to the corresponding reductions in leached N and in other N losses. If the value of the reduced leaching and other N losses is $5/ac, then the mean costs per ton of CO2e reduction are $40.76 for corn following corn and $28.92 for corn following soybean.
These results demonstrate that the practice of reducing N rates has the potential to be a highly cost-effective means of reducing CO2e emission to the atmosphere. For example, the total cost of CO2 capture, transport and near perpetual storage, such as capture for a coal-burning power plant, are estimated to range from $100 to more than $200 per ton CO2e.
These calculations for the effects of reduced N rate do not consider the eventual cost of reducing federal subsidies associated with yield. The calculations have not been extended to rainfed corn due to inadequate data for representing the great diversity of rainfed corn responses to N across Nebraska’s cropland.
| C:C | C:S | C:C | C:S | |
|---|---|---|---|---|
| 9 lb N / bu | 7 lb N / bu | |||
| N rate, lb N/ac | ||||
| EONR | 172 | 122 | 154 | 109 |
| -5% profit to N | 117 | 83 | 107 | 76 |
| Difference | -55 | -39 | -47 | -33 |
| Grain yield, bu/ac | ||||
| EONR | 233 | 222.5 | 230.5 | 222.1 |
| -5% profit to N | 223.6 | 217.2 | 221.6 | 215.4 |
| Difference | -9.4 | -5.3 | -8.9 | -6.7 |
| Marginal profit to fertilizer N use, $/ac | ||||
| EONR | 247 | 176.12 | 226.37 | 161.47 |
| -5% profit to N | 234.65 | 167.3 | 215.2 | 153.5 |
| Difference | -12.35 | -8.82 | -11.17 | -7.97 |
| N2O emitted as CO2e (lb/ac) assuming 1.25% of fertilizer N is emitted† | ||||
| EONR | 636 | 451 | 570 | 403 |
| -5% profit to N | 433 | 307 | 396 | 281 |
| Difference | -204 | -144 | -174 | -122 |
| CO2 emission associated with fertilizer N use @ 2.8 lb CO2e/lb N⁋ | ||||
| EONR | 482 | 342 | 431 | 305 |
| -5% profit to N | 328 | 232 | 300 | 213 |
| Difference | -154 | -109 | -132 | -92 |
| Average cost of CO2e reduction, $/t‡ | ||||
| Considering CO2e reduction only | 69.09 | 69.59 | 73.13 | 74.31 |
| Assuming the reduced leaching of nitrate-N is worth $5/ac⁋ | 41.12 | 30.14 | 40.39 | 27.69 |
| † IIPC uses 1% but more recent estimates range to much higher. Here we are addressing the upper part of the response curve where potential losses are relatively greater than with lower rates. Hence, we used a mean of 1.25% of applied N emitted as N2O applied across all fields. ‡ For comparison, the estimated costs of CO2 capture, transport, and near-perpetual storage, such as from a coal-burning coal plant, generally range from approximately $100/t to more than $200/t CO2. ⁋ CO2 emission associated with fertilizer N use assumed that applied N was accounted for as 50% from anhydrous ammonia with 1.9 kg CO2e per kg N and 50% from urea ammonium nitrate with 3.7 kg CO2e per kg N (Wood and Cowie, 2004). |
||||
The reductions in N loss to other processes are not addressed due to the complexities written of above. However, using N-LAT (Nitrogen Loss Assessment Tool (N-LAT) for Nebraska, NebGuide G2249), the mean leaching loss with the reduced N rate compared with the EONR was 40% less for corn following corn on occasionally flooded Invale loamy sand in Merrick County. This was with 43% of N spring applied as anhydrous ammonia and 57% applied in-season as UAN. The reduced N rate results in an estimated 18% less N loss to denitrification for this loamy sand soil.
Conclusion
The benefits of such a reduced N rate practice to society as a whole and the cost in terms of reduced profit to the corn grower should be widely shared. The cost-effectiveness of the practice for reduced CO2e and N loss can be used in a quest for reallocation of some federal and other subsidies to crop production to compensate for the reduced profit associated with this practice.
