Crediting some of the nitrate-N applied in irrigation water for determination of fertilizer-N rates has long been advised in Nebraska. However, other essential nutrients applied through irrigation have not been directly credited in fertilizer use decisions but some may have been credited through the interpretation of soil test results.
The essential soil-derived nutrients for crop growth are nitrogen (N), phosphorus (P), potassium (K), calcium (Ca), magnesium (Mg), sulfur (S), zinc (Zn), iron (Fe), copper (Cu), manganese (Mn) boron, (B), chorine (Cl), molybdenum (Mo), and nickel (Ni). Selenium, silicon, and cobalt are not essential to growth but selenium is essential to humans and animals and supplied through plant consumption. Silicon is helpful to some plant species under some stress conditions. Each of the essential nutrients has its special functions and any deficiencies can be limiting to growth. The sodium adsorption ratio and electrical conductivity are also indicative of irrigation water quality.
In a UNL survey (The Nebraska Water Quality Survey, EC 65-165 by Culbertson, Fischbach, et al.), 1200 irrigation water samples from 85 of the 93 counties in Nebraska were analyzed for some nutrients (Table 1). This survey was done in the 1960s, largely forgotten, and apparently not systematically repeated. It is likely that some concentrations have increased since the 1960s due to leaching of mobile nutrients such as N, S and B. However, the results are indicative of the value of nutrients applied currently through irrigation.
| P | K | Ca | Mg | S | B | Cl | |
|---|---|---|---|---|---|---|---|
| Concentration, ppm | |||||||
| Mean | 0.21 | 12 | 42.5 | 16.5 | 19.6 | 0.14 | 11.57 |
| Min | 0.08 | 4 | 17.7 | 1.8 | 0.6 | 0.01 | 0.04 |
| Max | 1.14 | 66 | 86 | 45.7 | 167.1 | 0.9 | 51 |
| Median | 0.18 | 10.2 | 42.6 | 14.8 | 12.9 | 0.11 | 9.25 |
| Amount applied in one acre-foot of water | |||||||
| Mean | 0.56 | 32.6 | 115.7 | 44.9 | 53.5 | 0.37 | 31.48 |
| Min | 0.22 | 10.9 | 48.2 | 4.9 | 1.6 | 0.03 | 0.11 |
| Max | 3.1 | 179.6 | 234 | 124.3 | 454.7 | 2.45 | 138.76 |
| Median | 0.49 | 27.8 | 115.8 | 40.1 | 35.1 | 0.3 | 25.17 |
| Estimated removal in 250 bu grain | |||||||
| Mean | 32.01 | 43.2 | 2.3 | 13.1 | 12.2 | 0.26 | |
The nutrients applied in irrigation water are expected to be as or more effective compared with those applied in fertilizer. The exceptions may be that the timing of irrigation application is too late for starter fertilizer effects, where these occur, and for enhanced greenness that is often achieved with early S application. However, applications contribute to enhanced nutrient availability in future years.
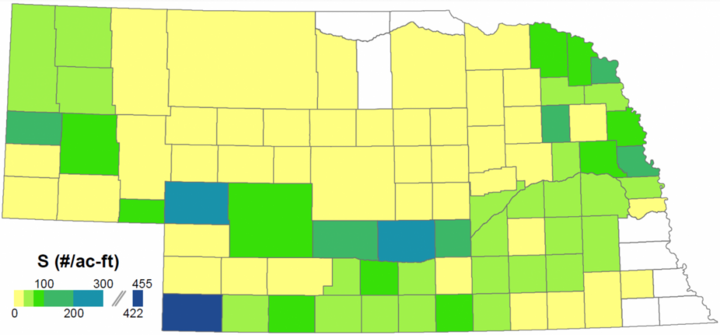
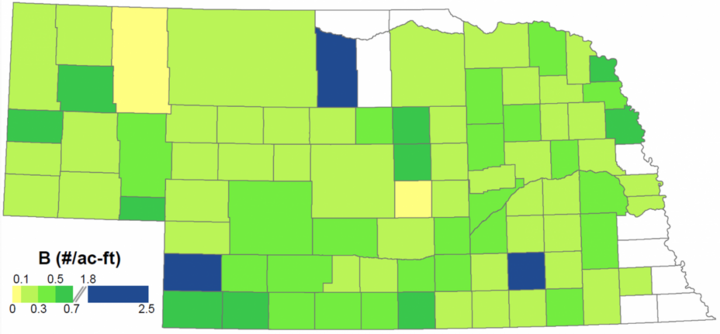
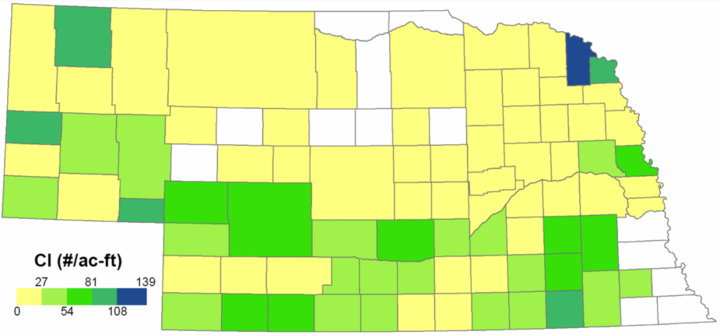
The results presented were calculated from the county averages (Table 1). In general, the average and median amounts of nutrient applied in one acre-foot of groundwater, relative to removal in the harvest of 250 bu corn, is small for P and about 65% for K, but in excess for Ca, Mg, S, and B. A typical recommended application rate for Cl in Kansas, where a soil test indicates deficiency, is 20 lb/ac, which is less than that typically supplied with an ac-ft of irrigation water.
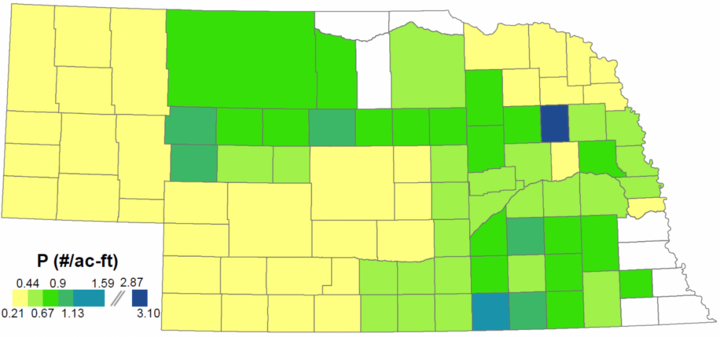
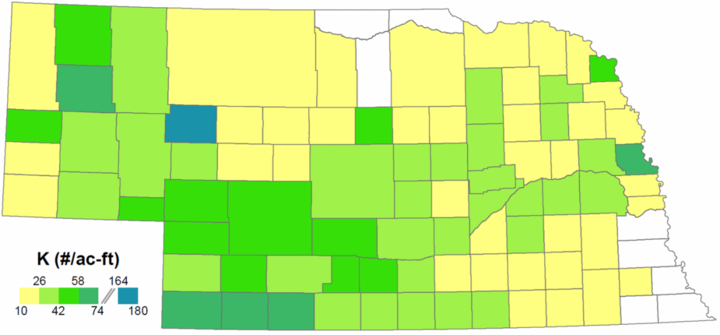
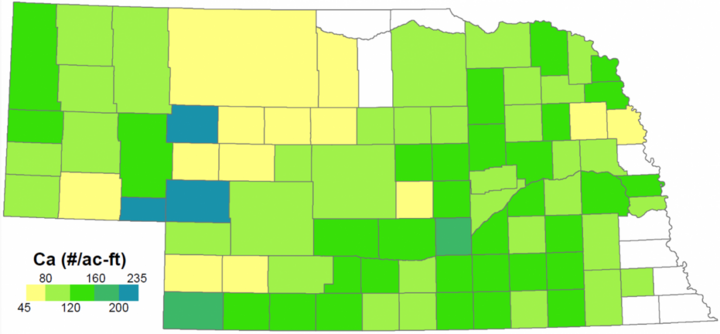
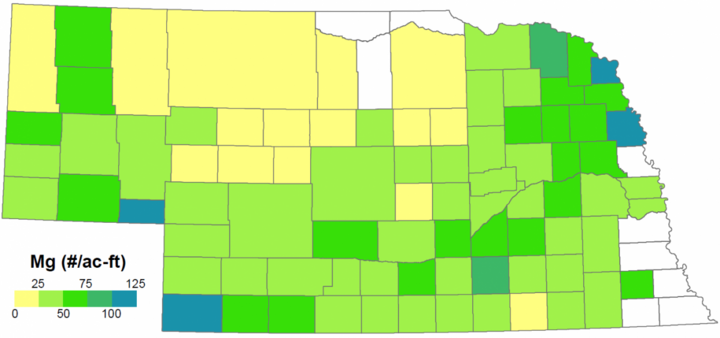
The minimum and maximum groundwater concentrations indicate the wide variation across counties, but there was also much variation within counties (Figure 1). Samples were not collected for the counties in white. Irrigation water sources may have much higher concentrations of one or more nutrients than indicated, but other nutrients may be at very low levels, and each water source should be tested. Some differences with neighboring counties may result from too few samples or a single sample with a very high concentration, and interpretation by groups of counties is more meaningful.
The maps confirm the small amount of elemental P supplied from irrigation with groundwater with generally
The information presented in this article is too generalized and too old to be used in fertilizer use decisions but demonstrates the value of testing each irrigation water source, including surface water sources, for concentrations of essential nutrients. In addition to the seven nutrients addressed here, analysis can also include zinc (Zn), iron (Fe), copper (Cu), manganese (Mn), and molybdenum (Mo), as well as nitrate-N, sodium adsorption ratio (SAR), electrical conductivity, pH, and bicarbonate concentration. Concentrations are not expected to change much over the years and the results of one test can be used for 10 or more years. However, each irrigation water source should be tested for greatest confidence in the results.
- About 10 ounces of water are needed for the full analysis but confirm this with the laboratory. The laboratory may be able to provide sample containers.
- Any contamination can greatly affect results and containers should be rinsed several times before collecting samples.
- Wells should be pumped for at least 24 hours before sample collection, preferably at the peak of the irrigation season.
- Samples of surface water should be collected from below the surface.
