Soil-water status (soil moisture) plays a critical role in determining the yield potential of crops. Soil-water in the plant root-zone must be maintained in a balance so that plants can optimize their transpiration (biomass/yield production process) as well as water, nutrient, and micronutrient uptake. Accurate determination of soil-water status (either matric potential or water content) is not only important for irrigation and water resources management, it is also a fundamental element of soil-water movement, chemical (fate) transport, crop water stress, evapotranspiration, hydrologic and crop modeling, climate change, and other important disciplines. Irrigation management requires the knowledge of “when” and “how much” water to apply to optimize crop production and increase and maintain a high level of water use efficiency. Too light or infrequent irrigation applications can impose water stress on crops, which can also cause irreversible damage. This can lead to reductions in crop yield and yield quality.
Volumetric soil water content (SWC) indicates the quantity of water in the soil but does not directly indicate the availability of this water to plants.
Soil matric potential (SMP) represents the relative availability of the amount of water held in the soil profile for plant uptake/use. SMP indicates how much energy plants will have to exert to extract the water molecules from soil particles.
Too much water or frequent irrigations may cause anaerobic soil conditions and promote undesirable chemical and biological reactions in the soil, which can reduce yields and water and energy resources. For example, a multi-year study at the UNL South Central Agricultural Laboratory near Clay Center (Irmak, 2014) reported that having 25% more water than was needed in the maize root-zone reduced grain yields as much as 15 bu/ac, which is a substantial portion of attainable maize yield in south-central Nebraska. Reduced oxygen concentrations in soil due to wet soil or flooding conditions can cause stomatal closure of plants, which causes plant stress because plants cannot transpire water vapor at an optimal/potential rate although water is available. Some researchers have reported that soil-oxygen deficiency can cause stomata closure as well, even when plants do not experience water deficit stress. As a result, stomata closure reduces the transpiration rate and yield because transpiration and yield are strongly and linearly correlated (Irmak, 2016).
Given its vital importance to numerous processes, plant physiological functions, and soil-water-atmosphere relationships, soil moisture determinations and irrigation management decisions must be made based on technology rather than non-technological approaches (i.e., hand-feel method, calendar day approach, neighbor’s schedule, visual observations of soil and/or crop status) to optimize crop production efficiency. Furthermore, unlike some weather variables, soil moisture is not a transferrable variable between locations or fields. It is a field-specific variable that must be measured for each field.
Expression of Soil-Water Status
Soil-water status in the soil profile can be expressed in two very different ways:
- Volumetric soil water content (% vol)
- Soil matric potential (kPa)
Volumetric soil water content (SWC) indicates the quantity of water in the soil but does not directly indicate the availability of this water to plants. Soil matric potential (SMP) represents the relative availability of the amount of water held in the soil profile for plant uptake/use. The quantity of soil-water from SMP is determined through soil-water characteristics curves developed for specific soil types. In more practical terms, SMP is a direct indication of how much energy must be exerted (application of pressure) by plants to extract the water molecules from soil particles. As the soil gets drier, the plants must exert increasingly more energy to extract water molecules. This is because water molecules are extracted from the large soil pores first and water is held more tightly in the smaller pores and the bond between water molecules and soil pores becomes even stronger as the soil gets drier. Plants extract most readily available water molecules first and gradually extract more strongly held water molecules. This is why SMP gradually increases as the soil gets drier (the maximum value of SMP is zero, which indicates very wet soil conditions). As the soil gets drier, SMP increases negatively (more negative tension), but in practical applications, the negative sign in SMP is usually ignored.
Irrigation Trigger Points (Thresholds) when Using Soil Water Content (SWC)-Based Sensors
While the author developed some of the first guidelines for irrigation management/irrigation trigger points for different soil types using SMP values for Watermark and other SMP-based sensors, the guidelines for irrigation management/trigger points using SWC-based sensors did not exist. This is the first publication that developed research-based irrigation trigger points for different soil types using SWC-based measurements. In Table 1, soil textural characteristics, soil-water holding capacity, and suggested ranges of SWC-based irrigation trigger points (% volume) are presented.
If the soil moisture sensors are not well-calibrated, the trigger points, as well as the soil moisture sensor readings will be erroneous, resulting in
- non-optimal crop production;
- a waste of energy, time, labor, water, and financial resources; and
- compromise yield quality and quantity.
These SWC-based trigger points were calculated assuming no sensor malfunction. The trigger points are applicable to any SWC-based sensor. They were calculated based on approximately 35%-40% depletion of the total soil-water per foot of soil layer. The sensor readings and the trigger points should be verified/checked against the crop appearance in the actual field conditions during the season (at least during the first season when this approach is implemented). For irrigation management, the irrigation trigger point should be the average of the first 2 feet of SWC sensors (average of top one- and two-foot sensor readings, when sensors are installed with 30-inch increments) prior to crop reproductive stages (for example, before R3 stage for soybean; tassel stage for corn). Once the crop reaches the reproductive stage, the first 3 feet (average of the top first, second, and third sensor readings) should be used. However, for sandy soils, the average of the top two sensor readings should be used as a trigger point at all times during the season to trigger irrigations due to very low water-holding capacity. It should be noted that some of the soil characteristics are also provided in Table 1 because trigger points are a function of these soil-water characteristics. For the same soil series, the trigger points may vary due to differences in these characteristics. For example, even though two soils can be classified as Hastings silt loam soil, their particle size distribution (i.e., percent sand, silt, and clay), field capacity (FC), permanent wilting point (PWP), bulk density (BD), saturated hydraulic conductivity (Ksat), and other characteristics can be different and they would have different irrigation trigger points. Since it is extremely difficult to present the trigger points for every soil series, soils are grouped under five classifications in Table 1.
Since every SWC-based soil moisture sensor measures SWC with some degree of error, to accommodate at least some of the measurement errors (related to resolution/sensitivity and precision) in SWC-based sensors, safety factors were also included in the trigger values presented in Table 1. It is very important to note that the irrigation trigger points presented in Table 1 assume that the SWC sensor used to measure these trigger points is well-calibrated for the soil conditions in which the sensor is deployed. If the soil moisture sensors are not well-calibrated, the trigger points, as well as the soil moisture sensor readings. will not be useful, and both will result in erroneous trigger points and irrigation applications. In turn, this will result in non-optimal crop production; waste energy, time, labor, water, and financial resources; and compromise yield quality and quantity.
Soil textural and hydraulic characteristics |
Soil textural properties, water-holding capacity, and irrigation trigger points for various soil types when using soil water content sensors | |||||
|---|---|---|---|---|---|---|
| Silty clay loam topsoil, silty clay subsoil (Sharpsburg) | Clay loam | Upland silt loam topsoil, silty clay loam subsoil (Hastings, Crete, Holdrege) | Sandy loam | Loamy sand (O'Neill) | Sand (Valentine) | |
| % Sand | 10 | 33 | 20 | 65 | 82 | 92 |
| % Clay | 34 | 34 | 20 | 10 | 6 | 5 |
| % Silt | 56 | 33 | 60 | 25 | 12 | 3 |
| FC (% vol) | 37.9 | 35 | 32.2 | 17.9 | 12 | 9.4 |
| PWP (% vol) | 21.0 | 21.3 | 17.3 | 8.1 | 5.7 | 5 |
| Saturation (% vol) | 51.0 | 47.20 | 48.2 | 45.0 | 45.70 | 46 |
| Ksat (in/hr) | 0.23 | 0.18 | 0.48 | 1.98 | 3.59 | 4.50 |
| BD (lbs/ft3) | 81.06 | 87.39 | 85.67 | 91.10 | 89.78 | 88.90 |
| BD (gr/cm3) | 1.30 | 1.40 | 1.37 | 1.50 | 1.44 | 1.42 |
| Water-holding capacity (in/ft) | 1.80-2.0 | 1.60-1.80 | 2.20-2.30 | 1.20-1.80 | 0.75-1.10 | 0.50-0.60 |
| Suggested range of irrigation trigger points when using SWC sensors (% vol) | (25-27) | (23-25) | (23-24) | (12-14) | (8-10) | (6-8) |
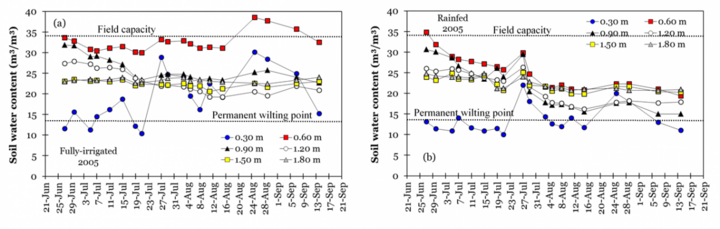
In Figure 1a and b, SWC fluctuates as a function of rainfall and/or irrigation and soil evaporation and transpiration (evapotranspiration). SWC increases with irrigation and/or rainfall and decreases as soil-water is taken up by plants. When irrigation is applied, soil-water should be replenished up to about 90% of FC so that some storage remains in the profile to store any potential rainfall. In both figures, it is clear that the driest layer is the top 1 foot and SWC in this layer fluctuates with the largest magnitude as this layer is subject to direct radiation, soil evaporation, and plant water uptake as most of the plant roots are in the first one-foot layer. In the fully irrigated treatment (Figure 1a), the SWC in most of the layers is managed between field capacity and permanent wilting point and there is no clear decreasing trend as irrigations maintained SWC adequate for plant growth, development, and meeting the evapotranspiration demand. Since there is no irrigation in the rainfed treatment (Figure 1b), the SWC in almost all soil layers has a decreasing trend due to insufficient rainfall to meet crop water demand, which is typical for rainfed cropping systems.
Irrigation Trigger Points (Thresholds) when Using Soil Matric Potential (SMP)-Based Sensors
Trigger-based irrigation management is a unique, robust, and research-based approach that does not require measuring precipitation or tracking soil water status for water balance calculations to determine irrigation trigger.
Similarly, Table 2 presents the soil-water depletion per SMP readings in kPa (cbar) and the range of irrigation trigger points for eight major soil types. These trigger points and depletion levels are not unique to only Watermark sensors and can be used for any other soil moisture sensors that measure SMP. As was the case in Table 1, safety factors were built into the SMP-based trigger point calculations to account for uncertainties in SMP measurements. These SMP-based trigger points have been successfully used in the NAWMN functions and are still valid. They represent the latest information and data on SMP-based irrigation management practices. Between Tables 1 and 2, practitioners can manage irrigations using any kind of well-calibrated SWC-based or SMP-based soil moisture sensors for up to eight major soil types. The trigger point-based irrigation management is a unique, robust, and research-based approach that does not require measuring precipitation or tracking soil water status for water balance (budget) calculations to determine irrigation trigger. The SWC or SMP sensors would measure the change in SWC or SMP in the soil profile and will respond to any precipitation events by measuring the change in SWC or SMP and the values will fluctuate until the irrigation trigger point is reached for a given soil type.
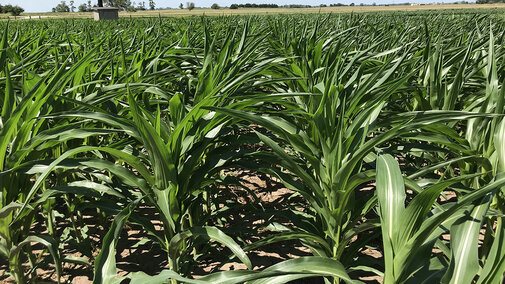
Examples of SWC values measured using a neutron probe in a center pivot-irrigated corn field at the South Central Agricultural Laboratory are presented in Figure 1 (adopted from Irmak, 2015). The SWC was measured with 1-foot increments down to a 6-foot soil depth on a weekly or every other week basis in fully irrigated (a) and rainfed (b) treatments. Field capacity (FC) and permanent wilting point (PWP) values (34% and 14% volume, respectively) are marked on the graphs for reference. For irrigation purposes, soil-water in the crop root-zone should be managed between field capacity and the permanent wilting point as this is the amount of water available for plant uptake. Soil water content should not be allowed to get close to the permanent wilting point as this can cause severe stress and/or irreversible damage to plants. It’s important to use technology to monitor soil-water status to make effective decisions to maintain optimum soil-water in the crop root zone, which otherwise cannot be determined using visual, hand-feel, or other qualitative methods.
Soil matric potential (kPa) |
Soil type, depletion in inches per foot associated with a given soil matric potential value measured by the Watermark and other soil matric potential sensors, and available water-holding capacity for different soil types. | |||||||
|---|---|---|---|---|---|---|---|---|
| Silty clay loam topsoil, silty clay subsoil (Sharpsburg) | Silt-loam topsoil, clay loam subsoil | Upland silt loam topsoil, silty clay loam subsoil (Hastings, Crete, Holdrege) | Bottomland silt-loam (Wabash, Hall) | Find sandy loam | Sandy loam | Loamy sand (O'Neill) | Find sand (Valentine) | |
| 0 | 0.00 | 0.00 | 0.00 | 0.00 | 0.00 | 0.00 | 0.00 | 0.00 |
| 20 | 0.00 | 0.00 | 0.00 | 0.00 | 0.20 | 0.30 | 0.30 | 0.30 |
| 33 | 0.20 | 0.14 | 0.00 | 0.00 | 0.55 | 0.50 | 0.45 | 0.55 |
| 50 | 0.45 | 0.36 | 0.32 | 0.30 | 0.80 | 0.70 | 0.60 | 0.70 |
| 60 | 0.50 | 0.40 | 0.47 | 0.44 | 1.00 | 0.80 | 0.70 | 0.70 |
| 70 | 0.60 | 0.50 | 0.59 | 0.50 | 1.10 | 0.80 | 0.80 | 0.80 |
| 80 | 0.65 | 0.55 | 0.70 | 0.60 | 1.20 | 1.00 | 0.93 | 1.00 |
| 90 | 0.70 | 0.60 | 0.78 | 0.70 | 1.40 | 1.20 | 1.04 | N/A |
| 100 | 0.80 | 0.68 | 0.85 | 0.80 | 1.60 | 1.40 | 1.10 | N/A |
| 110 | 0.82 | 0.72 | 0.89 | 0.88 | N/A | N/A | N/A | N/A |
| 120 | 0.85 | 0.77 | 0.91 | 0.94 | N/A | N/A | N/A | N/A |
| 130 | 0.86 | 0.82 | 0.94 | 1.00 | N/A | N/A | N/A | N/A |
| 140 | 0.88 | 0.85 | 0.97 | 1.10 | N/A | N/A | N/A | N/A |
| 150 | 0.90 | 0.86 | 1.08 | 1.20 | N/A | N/A | N/A | N/A |
| 200 | 1.00 | 0.95 | 1.20 | 1.30 | N/A | N/A | N/A | N/A |
| Water-holding capacity (in/ft) | 1.8-2.0 | 1.8-2.0 | 2.20 | 2.00 | 1.80 | 1.40 | 1.10 | 1.00 |
| Suggested range of irrigation trigger points (kPa) | 75-80 | 80-90 | 90-100 | 75-80 | 45-55 | 30-33 | 25-30 | 20-25 |

Figure 2 shows an example of measured SMP in three soil depths in a variable-rate irrigated and variable-rate fertigated corn field at the UNL South Central Agricultural Laboratory in silt loam soil for a portion of the growing season. Similarly to SWC, the SMP fluctuated the most in the topsoil layer (1 foot) as a function of greater evaporative losses. This layer is subject to the most radiation, wind speed, crop water uptake, evaporation, etc. The second soil layer (2 feet) fluctuated to a lesser extent than the first layer and more than the third layer. During the season, the SMP reached irrigation trigger point several times (when the top two layers’ average SMP value reaches 90-100 kPa before tassel and when the average of the top three sensors’ SMP value is 90-100 kPa after tassel) which can provide an effective irrigation management information.
References
Irmak, S. and D.Z. Haman. 2001. Performance of the Watermark granular matrix sensor in sandy soils. Applied Engineering in Agriculture 17(6):787-795.
Irmak, S. 2014. Plant Growth and Yield as Affected by Wet Soil Conditions Due to Flooding or Over-Irrigation. Nebraska Extension NebGuide G1904.
Irmak, S. 2015a. Inter-annual variation in long-term center pivot-irrigated maize evapotranspiration (ET) and various water productivity response indices: Part I. Grain yield, actual and basal ET, irrigation-yield production functions, ET-yield production functions, and yield response factors. Journal of Irrigation and Drainage Engineering, ASCE 141(5):1-17. 04014068. doi:10.1061/(ASCE)IR.1943-4774.0000825.
Irmak, S. 2015b. Inter-annual variation in long-term center pivot-irrigated maize evapotranspiration (ET) and various water productivity response indices: Part II. Irrigation water use efficiency (IWUE), crop WUE, evapotranspiration WUE, irrigation-evapotranspiration use efficiency, and precipitation use efficiency. Journal of Irrigation and Drainage Engineering, ASCE 141(5):1-11. 04014069. doi: 10.1061/(ASCE)IR.1943-4774.0000826.
Irmak, S., J.O. Payero, B. VanDeWalle, J. Rees, G. Zoubek, D.L. Martin, W.L. Kranz, D.E. Eisenhauer, and D. Leininger. 2016. Principles and Operational Characteristics of Watermark Granular Matrix Sensor to Measure Soil Water Status and Its Practical Applications for Irrigation Management in Various Soil Textures. Nebraska Extension Circular EC783.
