For 2018, a pre-harvest marketing plan for non-irrigated corn coupled with a revenue protection crop insurance policy may provide an opportunity to lock in prices above expected breakeven. This article will discuss the advantages and disadvantages of pre-harvest marketing non-irrigated corn in February versus waiting to price until October.
When thinking about pre-harvest marketing non-irrigated corn, the old adage of “Don’t count your chickens before they hatch” often comes to mind. Today, the influence of this statement has diminished due to the safety net provided by revenue protection crop insurance. The advantage of a revenue protection crop insurance policy comes from the ability to recalculate the original guarantee if harvest price — the October average of the December corn contract — is higher than the projected price — the February average of the December corn contract.
We evaluated historical data to determine if pre-harvest pricing can generate more gross revenue than waiting to price at harvest. To do this, we compared the corn projected price and harvest price.
The main advantage of pricing in February rather than waiting until October is the higher average price (Table 1). Pre-pricing corn during the projected price crop insurance period (February) would gross approximately $0.19/bu more on average than waiting until the harvest price period (October). When spring boasted the higher price, prices were $0.56/bu higher on average than the harvest price.
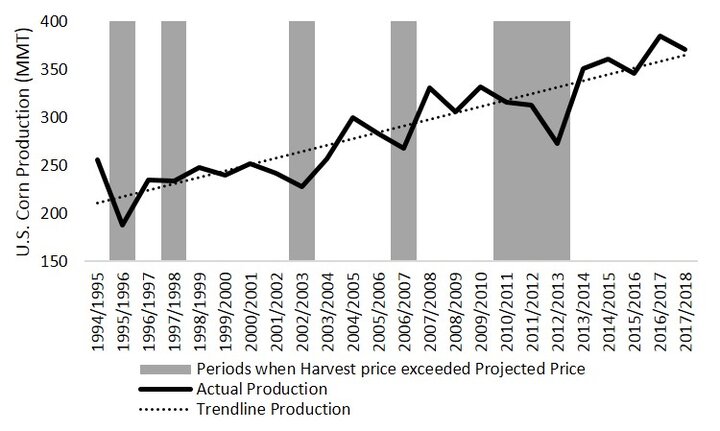
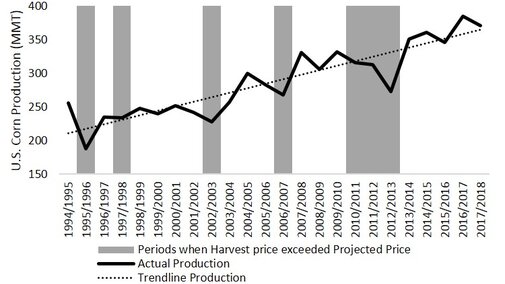
The harvest price is higher only about 30% of the time. In the years when higher harvest prices occurred, the price was substantially higher ($0.71/bu on average). Higher harvest prices occur because U.S. corn production is below trend line expectations, implying a lower realized yield (Figure 1). This is a concern for non-irrigated corn farmers, who have a higher yield risk than their irrigated counterparts. While we are focusing on futures price risk, basis is also likely to fluctuate, but not to the extent of futures prices.
Potential Disadvantages to Early Pre-Pricing
Pre-harvest marketing becomes financially painful when a farmer pre-prices more than they have produced AND prices rise. If both of these conditions occur, the farmer cannot deliver the quantity of grain they have contracted, and they will likely have to pay penalties to the grain buyer. These penalties are often called “buyback” penalties. In this situation, payments from a revenue protection policy can be used to offset buyback penalties. Limiting forward contracting alleviates the cost of buyback; however, it is always optimal to not have done any pre-harvest marketing with a revenue protection policy when non-irrigated corn growers are experiencing a drought.
Another disadvantage to pre-pricing significant amounts of expected corn production in February is that it limits your ability to capture future growing season marketing opportunities. This is true for both irrigated and non-irrigated producers.
Conclusion
Your comfort level of pre-harvest marketing, crop insurance contracts, and production costs represent the driving forces influencing the amount of pre-harvest marketing. If you’re a heavy pre-harvest marketer, you should be buying a higher insurance coverage level to guarantee more bushels.
| Year | Projected Price1 | Harvest Price2 | Difference |
|---|---|---|---|
| 1994 | $2.68 | $2.16 | $0.52 |
| 1995 | $2.57 | $3.23 | -$0.66 |
| 1996 | $3.08 | $2.84 | $0.25 |
| 1997 | $2.73 | $2.81 | -$0.08 |
| 1998 | $2.84 | $2.19 | $0.65 |
| 1999 | $2.40 | $2.01 | $0.38 |
| 2000 | $2.51 | $2.04 | $0.47 |
| 2001 | $2.46 | $2.08 | $0.38 |
| 2002 | $2.32 | $2.52 | -$0.20 |
| 2003 | $2.42 | $2.26 | $0.17 |
| 2004 | $2.83 | $2.05 | $0.78 |
| 2005 | $2.32 | $2.02 | $0.29 |
| 2006 | $2.59 | $3.03 | -$0.44 |
| 2007 | $4.06 | $3.58 | $0.48 |
| 2008 | $5.40 | $4.13 | $1.27 |
| 2009 | $4.04 | $3.72 | $0.32 |
| 2010 | $3.99 | $5.46 | -$1.47 |
| 2011 | $6.01 | $6.32 | -$0.31 |
| 2012 | $5.68 | $7.50 | -$1.82 |
| 2013 | $5.65 | $4.39 | $1.26 |
| 2014 | $4.62 | $3.49 | $1.12 |
| 2015 | $4.15 | $3.83 | $0.32 |
| 2016 | $3.86 | $3.49 | $0.36 |
| 2017 | $3.96 | $3.50 | $0.46 |
| Average Change | $0.19 | ||
| Average Spring High | $0.56 | ||
| Average Harvest High | $0.71 | ||
|
1 The projected corn price is the average of the December corn contract from Feb. 1 – Feb. 28 of the given year. |
|||
