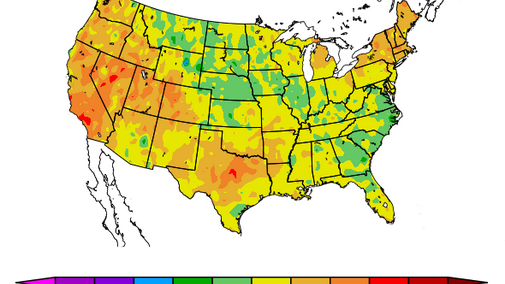
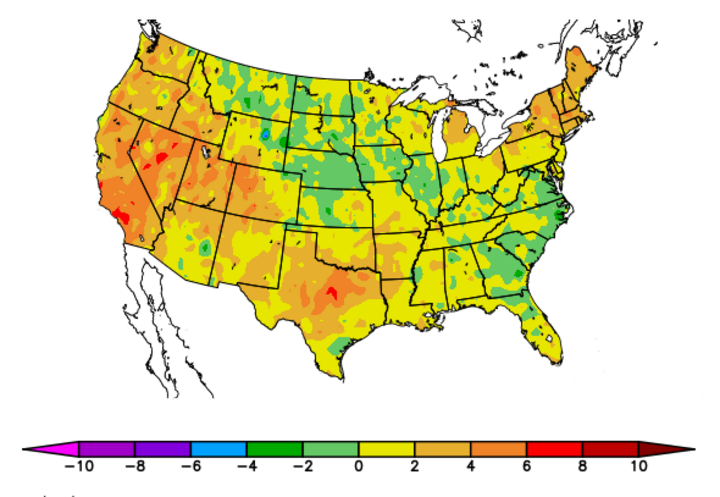
Above normal temperatures that were prevalent across the Corn Belt during June slowly gave way to cooler than normal conditions during the second half of July. There was enough cooling the final full week of July to offset the slightly above normal temperatures experienced during first 10 days of July (Figure 1).
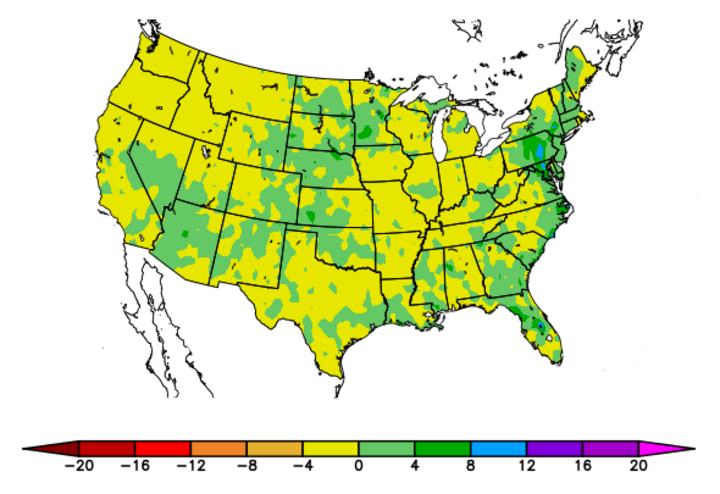
The bulk of above normal moisture experienced across Nebraska during July fell across the western half of the state, while below normal moisture returned to portions of south central, central, east central, and southeastern Nebraska (Figure 2). Crop water stress concerns eased with the cooler weather, but the lack of moisture is a concern if temperatures revert back to above normal conditions during August.
With July in the books, the impacts of temperatures on estimated crop maturity can now be updated from the early July assessment. Estimated corn crop maturity has been pushed back one to three days, but 75% of the crop is projected to mature between Aug. 25 and Sept. 9.
Precipition chances statewide drop below 20% Aug. 9-15, with the lowest probabilities (near zero) currently assigned to south central and southeast Nebraska. This, coupled with 90+ high temperatures, is likely to cause further crop deterioration across dry areas of southern Nebraska.
For every degree the temperatures are below normal for the month of August, expect an additional 1 to 1.5 days on the maturity estimates. Conversely, for every degree average temperatures are above normal for August, reduce the estimated maturity date by 1 to 1.5 days.
Early August Forecast
Short-term forecasts out to August 15 indicate that the western U.S. upper air ridge will begin to break down this weekend and allow cooler air to infiltrate the state this weekend through the middle of next week, according to the Aug. 3 GFS 12 Z model. The cool down will begin across northern Nebraska on Aug. 4 and slowly build southward through Aug. 6. Temperatures will cool into the low to mid 80s, while the southern third of the state will see upper 80s to low 90s this weekend, cooling into the mid to upper 80s on Monday. Temperatures are expected to remain in the low 80s north to upper 80s south through the middle of next week before the upper air ridge begins to build back into the central Plains. High temperatures are once again expected to return to the 90s from Aug. 9-15, with upper 90s possible across western Nebraska from Aug. 10-13.
Our best precipitation chances during the first half of August are this weekend through early next week, according to the August 3 GFS 12 Z model. The best chances for moisture on Aug. 4 will be from southwest to northeast Nebraska, shifting to east central and northeast Nebraska on Aug. 5. Additional chances for thunderstorm activity are indicated Aug. 6-8, primarily centered on west central and southwestern Nebraska. The precipitation forecast for Aug. 4-10 is 0.50-1.25 inches across the northern two-thirds of the state and 0.25 -0.75 inches across the southern third of the state. Unfortunately, southeast and south central Nebraska is the region the models portray at the bottom end of the forecasted precipitation range.
Overall, precipition chances statewide drop below 20% Aug. 9-15, with the lowest probabilities (near zero) currently assigned to south central and southeast Nebraska. This coupled with 90+ high temperatures is likely to cause further crop deterioration across dry areas of southern Nebraska.
We will see if the models finally can get a two-week forecast correct. A sudden change in the models would not be unexpected, but if the current model runs verify, crop water use will be above normal with little atmospheric support for moisture. With soil moisture levels across our southern dryland areas running low on moisture after the wet conditions during June, crop stress is likely to reappear as early as next week and intensity through mid-August.
Longer Term Forecast and El Nino Outlook
Looking even further down the road, an El Nino watch has been issued by the Climate Prediction Center. Figure 3 shows global sea surface temperature anomalies as of July 31. Abnormal warmth is shown for the Gulf of Alaska and the Equatorial Pacific. Below normal sea surface temperatures are prevalent across the Equatorial Atlantic and eastern North Atlantic. Our immediate area of concern is the Pacific Equatorial region.
Above normal sea surface temperatures began to build in the late spring in the eastern Equatorial Pacific and have spread westward to cover the eastern two-thirds of this region at present. CPC also indicates that a pool of warm water (above normal) below the surface exists from Australia to South America. This pool moves from west to east and takes about six months to complete the trek from Australia to South America.
With such an expansive warm pool underneath the Equatorial Pacific, El Nino conditions are likely to remain in place through mid-winter, possibly longer depending on whether this pocket continues to be refreshed on the Australian side of the Pacific. With the Gulf of Alaska also showing above normal sea temperatures, there is no anomalous cold pools available to feed into the Equatorial Pacific that could limit El Nino development.
El Nino’s have their greatest impacts on the Southern Hemisphere’s cropping region because they are usually at their peak during the Southern Hemisphere’s summer. The Climate Prediction Center's map of El Nino Related Global Patterns indicates the typical anomalies experienced during El Nino. The June-August anomalies are for the winter period leading up to the Southern Hemisphere cropping season, whereas the December-February anomalies are the typical conditions felt during their summer growing season.
The anomalies projected in the Climate Prediction Center's map of El Nino Related Global Patterns occur over 70% of the time. These patterns can provide Northern Hemisphere producers advanced knowledge of the likely conditions that will be felt during their growing seasons. Typically, Australia’s wheat crop has major problems during El Ninos, along with South Africa’s corn crop. Argentina usually has above normal corn yields, while Brazil soybeans come in normal to below normal.
Across the contiguous U.S., the primary impacts of El Nino are felt during the winter. Below normal temperatures and above normal moisture are common across the southern third of the U.S. This usually translates into above normal wheat prospects for the following summer. Below normal moisture is common across the eastern Corn Belt (Ohio and Indiana) and the Pacific Northwest. Warmer than normal conditions are common from the Pacific Northwest through the northern Plains.
