| Corn | Soybeans | Wheat | |
|---|---|---|---|
| United States | 2017/18 | 2017/18 | 2017/18 |
| Million Acres | |||
| Area Planted | 90.2 | 90.1 | 46 |
| Area Harvested | 82.7 | 89.5 | 37.6 |
| Bushels | |||
| Yield per Harvested Acre | 176.6 | 49.1 | 46.3 |
| Million Bushels | |||
| Beginning Stocks | 2,293 | 302 | 1,181 |
| Supply, Total | 1,6947 | 4,718 | 3,076 |
| Use, Total | 1,4595 | 4,188 | 2,067 |
| Ending Stocks | 2,352 | 530 | 1,009 |
| Avg. Farm Price ($/bu.) | 3.05-3.55 | 8.90-9.70 | 4.55-4.65 |
Approximately 230 million acres of corn, soybeans, and wheat are planted in the U.S. annually. The price of these grains is dependent on annual supply and demand of the commodity domestically and internationally. Several factors influence supply and demand. The United States Department of Agriculture (USDA) summarizes these components in their monthly World Agriculture Supply and Demand Estimate (WASDE) report. Table 1 summarizes the February 2018 WASDE report.
A principal consideration in Table 1 is “Ending Stocks.” This value is the difference between the Total Supply and Total Use estimates. Ending stocks represent the projected quantity of a commodity that will remain unused at the end of the marketing year. These ending stocks are carried forward to the following marketing year as “Beginning Stocks,” adding to the total supply available.
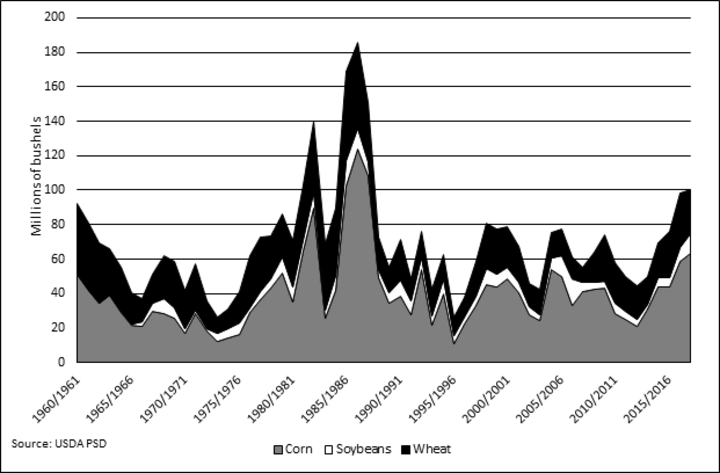
Figure 1 shows that since 2012, all three commodities have seen growing ending stocks, due to production outpacing domestic consumption and exports. These growing ending stocks are placing negative pressure on their respective prices.
Large ending stocks will continue to shape the U.S. grain market for the coming year.


Corn
Despite the fact that the total acres of corn planted in 2017 decreased 3.8 million acres to 90.1 million acres, U.S. ending stocks continue to rise due to high average yields (estimated at 176.5 bushels per acre). U.S. ending corn stocks are predicted to be 2,352 million bushels (203.09 MMT), according to the most recent WASDE report. High ending stocks in corn continue to place pressure on the average farm price for corn currently estimated between $3.05/bu. and $3.55/bu.
Soybeans
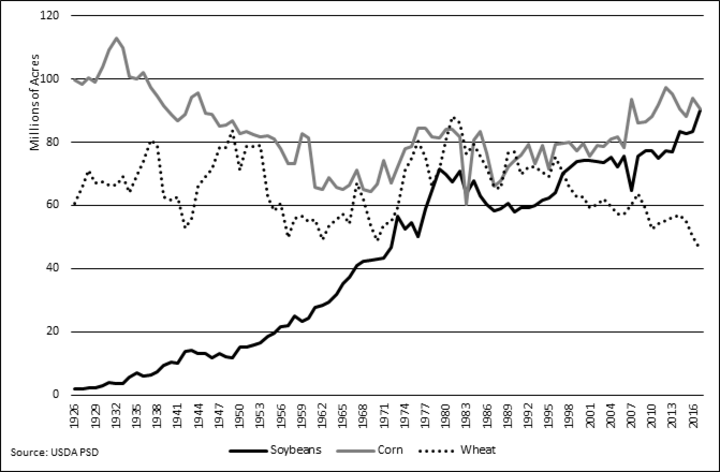
In 2017, a record number of soybeans acres (90.2 million) were planted in the U.S. Soybean acres are almost equivalent to the number of U.S. corn acres as shown in Figure 2. Growing acres of soybean production and increased yields have led to rising ending soybean stocks in the U.S. The WASDE report predicts U.S. ending soybean stocks at 530 million bushels (14.42 MMT) with the average farm price for soybean currently estimated between $8.90/bu. and $9.70/bu.
Furthermore, global production has also influenced U.S. soybean prices. Global ending stocks are estimated at 98.14 MMT, 1.422 MMT higher than 2016/17.
For the most recent USDA price estimates see the latest USDA WASDE report at https://www.usda.gov/oce/commodity/wasde/.
Wheat
Wheat acres planted in the U.S. have declined since the peak in 1981, falling to 46 million acres in 2017. Currently, the World Agriculture Supply and Demand Estimate (WASDE) report puts U.S. ending wheat stocks at 1,009 million bushels (27.47 MMT). Despite ending stocks being lower than recent years, the estimated average farm price continues to be suppressed, ranging from $4.55/bu. to $4.65/bu. These estimates include all classes of wheat. Hard Red Winter wheat is running approximately $1.00/bu. lower than this reported price.
| Table 2. The differences between corn contracts, often called a carrying charge or spread may allow those with on-farm storage to profit from storage. (Source: Chicago Board of Trade corn Price Carry, $/bu.) | ||||
|
|
EXAMPLE (CORN) |
Corn |
Soybeans |
Wheat |
|
Date |
11/9/2017 |
|
|
|
|
Nearby Price |
ZCZ17 $3.41 |
|
|
|
|
1st Differed Carry |
$0.13 |
|
|
|
|
2nd Differed Carry |
$0.22 |
|
|
|
|
3rd Differed Carry |
$0.30 |
|
|
|
Carrying Charges
Abundant supplies in the grain markets usually cause positive and growing differences between contract delivery months.
These differences between contracts are often called “carrying charges” or “spreads.” Carrying charges may provide opportunities for those with unpriced corn in on-farm storage to obtain higher prices for their grain. To capture this carrying charge, use a cash forward contract or hedge-to-arrive (HTA) contract. Before selling corn using one of these contracts, decide if the carrying charge is sufficient enough to cover the variable expenses of additional storage. Nebraska Extension has a carrying charge calculator that can help you make this decision visit go.unl.edu/carry to learn more.
