Weather conditions in June 2017 are thought to have contributed to the increased levels of dicamba injury discussed in stories in the Feb. 16, 2018 CropWatch. Following are the June 2017 daily maximum temperatures and average relative humidities for four sites in Nebraska. Also shown is the maximum daily wind for one minute at each site. Data for the Harvard site is in the article, Potential Off-Target Dicamba Movement from Corn Applications, which looks at how weather played a factor in off-target contamination.
Figure 1 Maximum daily temperatures and humidity levels recorded at the University's Panhandle Research and Extension Center at Scottsbluff in June 2017 (Source: Al Dutcher, Nebraska State Climate Office)
Figure 2. Maximum daily wind speed (mph) recorded at the University's Panhandle Research and Extension Center at Scottsbluff in June 2017 (Source: Al Dutcher, Nebraska State Climate Office)
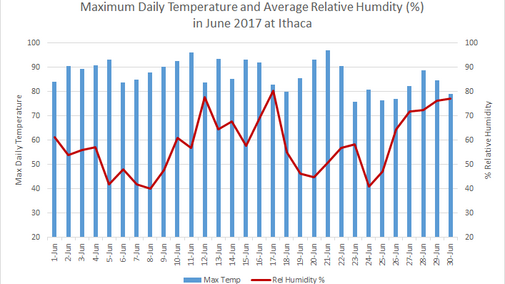
Figure 3. Maximum daily temperatures and humidity levels recorded at the university's Eastern Nebraska Research and Extension Center near Ithaca in June 2017 (Source: Al Dutcher, Nebraska State Climate Office)
Figure 4. Maximum daily wind speed (mph) recorded at the University's Eastern Nebraska Research and Extension Center near Ithaca in June 2017 (Source: Al Dutcher, Nebraska State Climate Office)
Figure 5. Maximum daily temperatures and humidity levels recorded at the university's Haskell Ag Lab near Concord in June 2017 (Source: Al Dutcher, Nebraska State Climate Office)
Figure 6. Maximum daily wind speed (mph) recorded at the University's Haskell Ag Lab near Concord in June 2017 (Source: Al Dutcher, Nebraska State Climate Office)
Figure 7. Maximum daily temperatures and humidity levels recorded at the university's University's West Central Research and Extension Center at North Platte in June 2017 (Source: Al Dutcher, Nebraska State Climate Office)
Figure 8. Maximum daily wind speed (mph) recorded at the University's West Central Research and Extension Center at North Platte in June 2017 (Source: Al Dutcher, Nebraska State Climate Office)