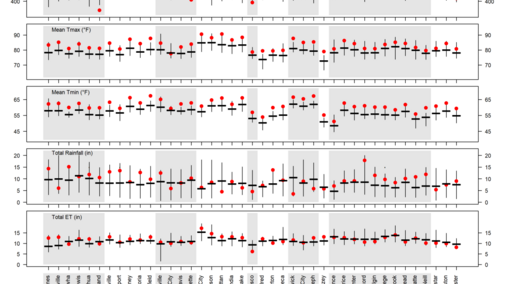
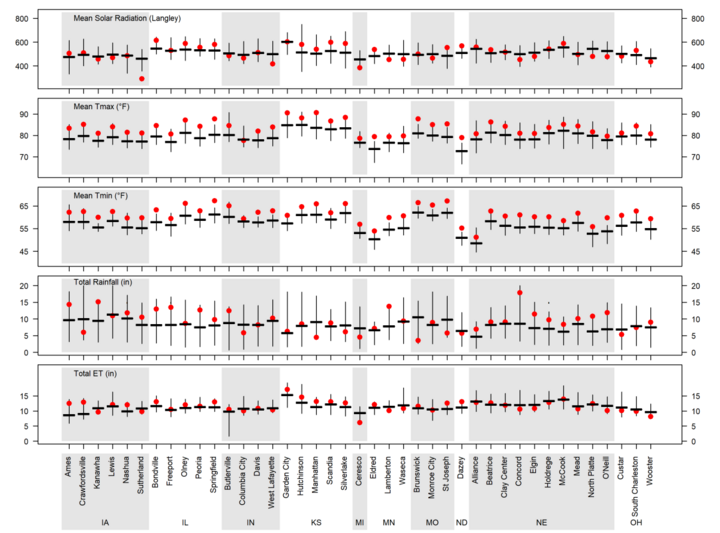
Figure 1. Daily solar radiation, maximum and minimum air temperature (Tmax and Tmin), total rainfall, and total reference grass-based evapotranspiration (ET) for the period between May 12 and July 11, 2018. Vertical bars indicate the range for these variables based on 20+ years of weather records. The horizontal thick line indicates the long-term average and the red dots indicate the 2018 values.
For the rest of the story, see 2018 Corn Yield Forecasts as of July 11: Higher Temperature Led to Faster Corn Development
