The Risk Management Agency (RMA) recently completed the 2018 price discovery period for corn and soybeans in Nebraska. The 2018 corn projected price came in at $3.96 with a 0.15 volatility factor. The 2018 soybean projected price came in at $10.16 with a 0.14 volatility factor. While 2018 projected prices are similar to those in 2017 — $3.96 for corn and $10.19 for soybeans —volatility factors are lower than those in 2017. A couple of useful points can be made to help producers interpret this year’s crop insurance prices and volatility factors.
Almost all crop insurance policies in Nebraska are Revenue Protection (RP) policies. RP policies use a projected price, a harvest price, and Actual Production History (APH) yield to determine revenue loss.
The “projected price” is the average of the December corn futures contract or the November soybean futures contract for February. The revenue guarantee for a farm is calculated by multiplying the projected price by that farm’s APH by the selected coverage level.
The “harvest price” is the average of the December corn futures contract or the November soybean futures contract for October. If the harvest price exceeds the projected price, the revenue guarantee is recalculated for each farm, using the harvest price instead of the projected price.
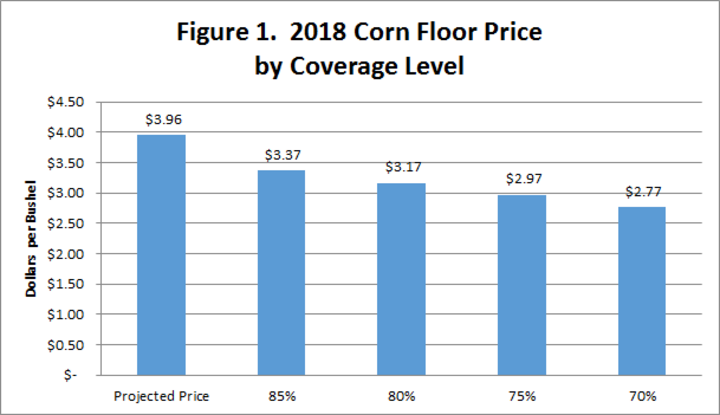
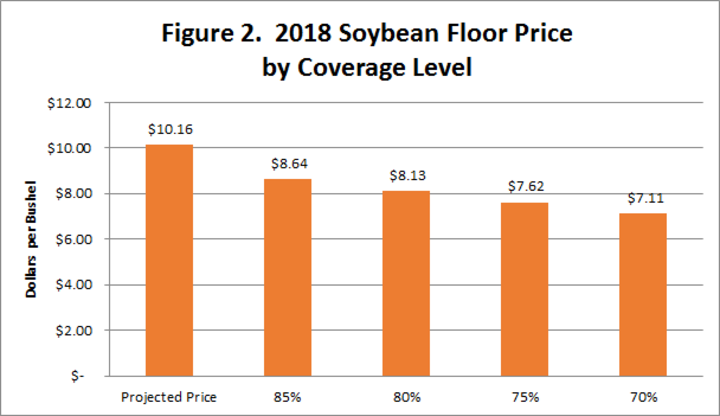
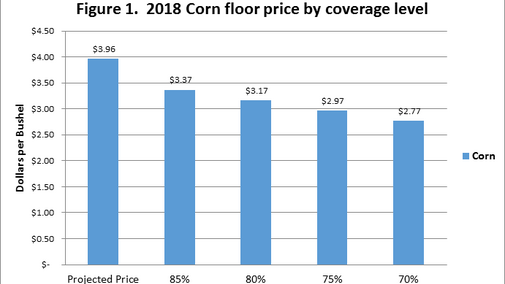
While each producer participating in an RP policy faces the same projected price, the actual price protection through an RP crop insurance policy depends on the selected coverage level. Figure 1 identifies the implied price protection across multiple coverage levels for corn while Figure 2 identifies the same information for soybeans. Holding yields constant (meaning the only source of a crop insurance payment can come from prices), producers with a higher coverage level have more downward price protection than those with lower coverage levels. If corn harvest prices end up at $3.18 and actual yield equals APH, producers with an 85% coverage level will receive a crop insurance payment. Those with an 80% coverage level or below will not receive a payment. If the harvest price is higher than the projected price, RP policy payments come from yield loss due to the recalculated revenue guarantee.
Finally, lower volatility factors imply lower premiums, given the rest of the crop insurance contract is unchanged. However, lower volatility factors also imply a narrower band of final harvest prices and therefore a narrow band of fall revenue.


