A cool start to the crop season followed by two months of above normal temperatures appears to be pushing Nebraska's corn crop to an earlier than normal maturity.
Begining in April, cool conditions delayed planting, resulting in 50% of the state’s corn crop emerging between May 6 (25% emergence date) and May 20 (75% emergence date), according to the Nebraska office of the National Agricultural Statistics Service. Above normal temperatures since emergence have rapidly advanced the state’s corn crop. (May was the fourth warmest and June the fifth warmest month on a statewide basis since records began in 1895.)
If normal temperatures are realized for the remainder of the season, 75% of the state’s corn crop will reach physiological maturity by Sept. 7. Table 1 shows the accumulated Growing Degree Day Units (Base 50/86) as of July 6 for the 25% and 75% emergence dates. Most locations were running 20-40% ahead of the normally expected GDD accumulations for that period.
Looking at Lincoln temperature records, a normal GDD accumulation from July 7 through August 31 is just over 1400 units. Therefore, with normal conditions through Aug. 31, corn in the Lincoln area that emerged May 6 would be expected to reach physiological maturity August 23; corn that emerged May 20, based on a 2700 GDD variety, would reach maturity Sept. 1. Normal GDD accumulations for this period range from just under 1500 GDDs at Falls City to just under 1350 GDDs in the northwest corner of the state.
Whether this rapid advancement of the state corn crop will be detrimental to yields remains to be seen, but consistent lows in the low to mid 70s like we saw in June can limit grain fill due to inadequate respirational cooling during the nighttime hours. We need cooler weather during grain fill to maximize kernel size. Temperature data suggests maturity will be extended 1.5 days for every degree we are below normal over the next 30 days.
Drought Areas Lessen
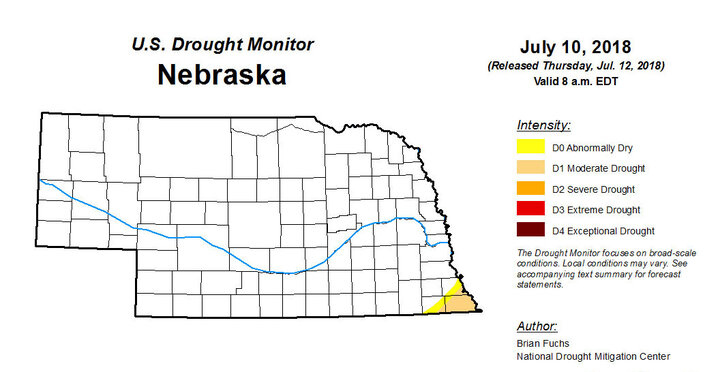
Thankfully, Nebraska saw significant rainfall in many areas in June, resulting in widespread elimination of drought conditions according the U.S. Drought Monitor. The only drought currently depicted is in extreme southeastern Nebraska (Figure 1). There were multiple rounds of precipitation dropping 2-6 inches over 24-hour periods; runoff was likely significant in areas with precipitation totals exceeding 3 inches in a given event.
However, I was on vacation and unable to contribute to Drought Monitor discussions of upgrades over a three-week period and believe the authors placed too much emphasis on short-term precipitation events. As has been a common problem with the U.S. Drought Monitor, reaction to short-term precipitation events are emphasized over long-term trends. Much of south central and southeast Nebraska still have 3-6 inch deficits dating back to the beginning of our water year (October 1).
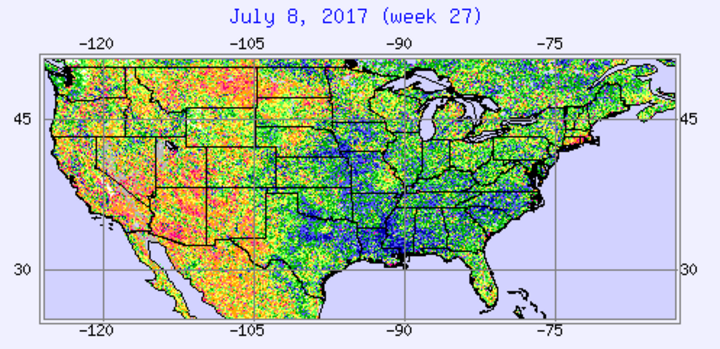
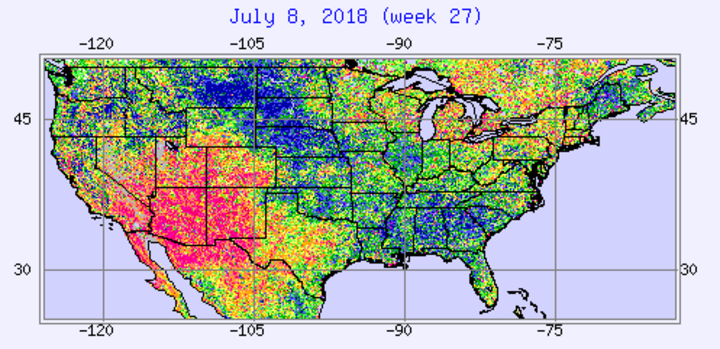
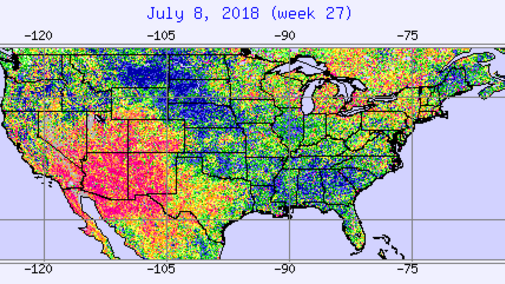
Vegetative Health Index maps for this week (Figures 2, 2017 and Figure 3, 2018) show good to excellent crop health for much of the western Corn Belt this year (Blue = excellent, light green = average, yellow = below average, and red = stressed crops). Drought-stressed crops quickly responded to recent rainfall through improved crop health. The lack of significant deep subsoil moisture (below 3 feet) in south central and portions of southeast Nebraska will continue to place these areas at risk for rapid deterioration if moisture is absent for more than 7-10 days through mid-August.
July Forecast
The current short-term outlook indicates a cold front will try to push through the state during the first half of this weekend. This would place much of north central and northeast Nebraska on the southern periphery of an area forecasted to receive 1.5-3.0 inches of rainfall. The front is expected to fall apart as it reaches southern Nebraska, resulting in more scattered convection.
Another cold front is expected to make its way southward from the Dakotas on Sunday, with reinforcing cool air on Tuesday. Thus, several additional chances of moisture exist, but models differences indicate a range of precipitation from 0.50 to 1.50 inches. Temperatures are expected to cool 6-10 degrees below normal during the middle of next week, gradually warming to near normal temperature by next weekend.
Forecasts beyond next weekend are exceedingly difficult. Recent model trends point to cooler than normal conditions redeveloping the last full week of July, the intensity of the forecasted cool down varies significantly depending on whether one looks at the morning or evening model updates. On the extreme end of the cool forecast are highs in the 70s and lows in the low 60s, while on the warm end of the forecast, highs would be in the mid-80s with lows in the upper 60s.
Precipitation forecasts from the middle of next week through the last full week of July are all over the board. Precipitation amounts appear more widespread using the cooler temperature forecast. The warmer forecast does indicate several opportunities for moisture, but they appear more isolated and localized. Both solutions would be enhanced if the atmosphere is able to draw monsoonal moisture out of the southwestern U.S. into central High Plains region.
| Station | Actual GDD 5/06-7/06 | Normal GDD GDD 5/06-7/06 | Difference | Percent Difference | Actual GDD 5/20-7/06 | Normal GDD 5/20-7/06 | Difference | Percent Difference |
|---|---|---|---|---|---|---|---|---|
| Ainsworth | 1240 | 978 | 262 | 25.6 | 1063 | 898 | 165 | 18.4 |
| Broken Bow | 1241 | 1002 | 239 | 23.9 | 1069 | 830 | 239 | 28.8 |
| Chadron | 1011 | 914 | 97 | 10.6 | 877 | 777 | 100 | 12.9 |
| Falls City | 1533 | 1170 | 363 | 31.0 | 1241 | 1006 | 235 | 23.4 |
| Grand Island | 1421 | 1069 | 352 | 32.9 | 1221 | 919 | 302 | 32.9 |
| Hebron | 1579 | 1072 | 409 | 38.1 | 1265 | 922 | 343 | 37.2 |
| Imperial | 1276 | 981 | 395 | 40.2 | 1093 | 836 | 257 | 30.7 |
| Lincoln | 1514 | 1158 | 356 | 30.7 | 1279 | 995 | 384 | 38.6 |
| McCook | 1330 | 991 | 339 | 34.2 | 1135 | 845 | 290 | 34.3 |
| Norfolk | 1294 | 1067 | 227 | 21.3 | 1122 | 918 | 204 | 22.2 |
| North Platte | 1218 | 976 | 242 | 24.8 | 1049 | 832 | 217 | 26.1 |
| Omaha | 1551 | 1140 | 411 | 36.1 | 1308 | 973 | 335 | 34.4 |
| Scottsbluff | 1060 | 908 | 252 | 27.8 | 912 | 772 | 140 | 18.3 |
| Sidney | 1041 | 926 | 115 | 12.4 | 907 | 787 | 120 | 15.3 |
| Valentine | 1226 | 949 | 277 | 29.2 | 1057 | 809 | 248 | 30.8 |
| May 6 is when 25% of corn had emerged statewide, according to the National Agricultural Statistics Service Nebraska report. May 20 is when 75% of corn had emerged statewide, according to the National Agricultural Statistics Service Nebraska report. |
||||||||
