The Climate Prediction Center (CPC) reissued its La Nina Watch on October 12, stating that the odds of a La Nina occurring during our North American winter have now increased to 55%-65%. Historical responses to individual La Nina events are not universal and usually are strongest during North American winters.
La Nina patterns are the result of the strengthening westerly wind fields from the surface through the mid-layers of the atmosphere that push warm surface water from the eastern to the western Pacific Equatorial basin. This brings cold upwelling currents to the eastern Pacific and spreads these colder-than-normal surface temperatures westward toward the central Equatorial Pacific.
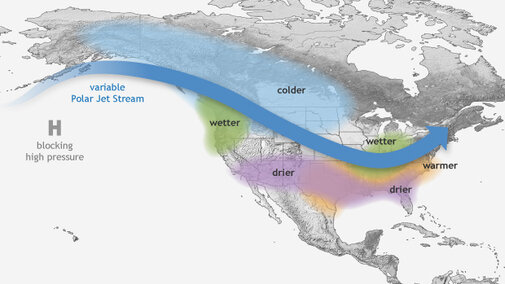
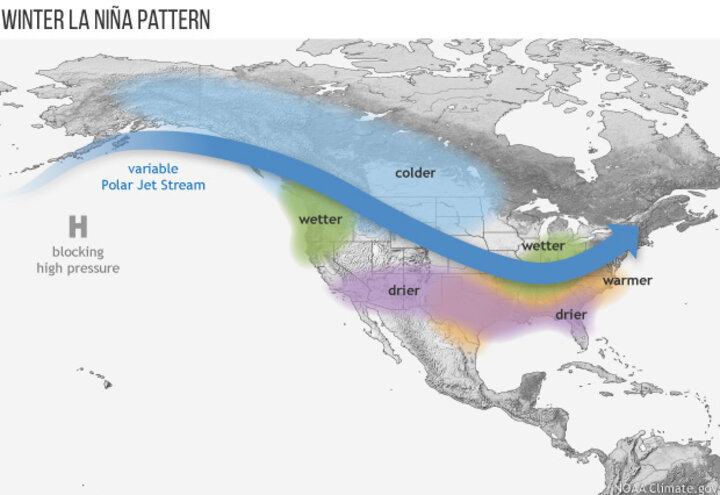
Figure 1 represents the mean jet stream pattern across North America during La Nina episodes. The Gulf of Alaska is dominated by high pressure aloft. The circulation pattern on the eastern edge of this high pressure area will see winds flow from a northerly to southerly direction. The position and intensity of this high pressure system will determine where air will ultimately travel.
What Figure 1 fails to show is that a variable Pacific jet will develop along the southern periphery of the Gulf of Alaska high pressure system, allowing surface lows to move from northern Japan eastward into the Pacific Northwest. The strength of the Gulf of Alaska high will determine the average southward mean position of the variable Pacific jet stream.
Across the continental U.S. there are regions that are highly correlated (more than 70% of the time) to temperature and/or precipitation patterns. The Pacific Northwest is wetter and cooler than normal, while the eastern Corn Belt is wetter than normal. Although there is a weak cold signal in the eastern Corn Belt, correlations don’t exceed 70%. The other strong signal is that drier and warmer-than-normal conditions will develop across the southern quarter to third of the United States.
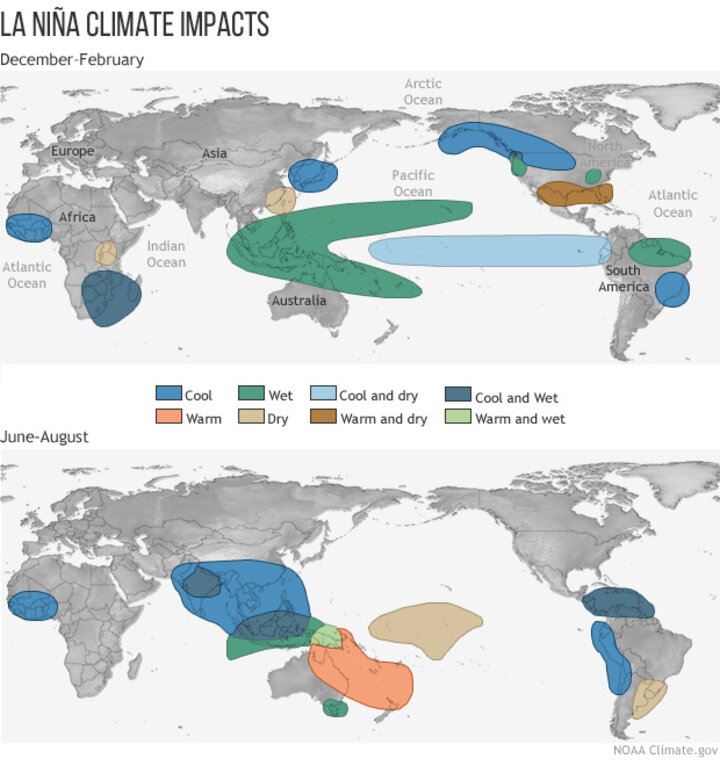
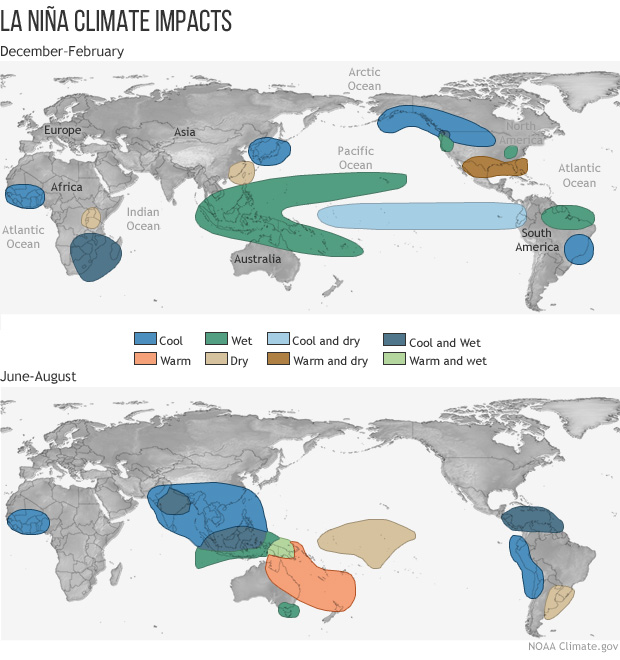
Agricultural producers should also note that most La Nina events are waning or completely over before spring planting has been completed in the United States. The real agricultural impacts to grain production most commonly occur across the Southern Hemisphere, which is in the midst of its summer crop season while we’re slogging through winter. Figure 2 encapsulates average La Nina responses across the globe. Pay particular attention to the impacts in Brazil (soybeans), South Africa (corn), and northeastern Australia (wheat).
Even if a La Nina event develops, the jet stream configuration in Figure 1 is a composite average of all events and any given year may deviate significantly from this mean pattern. The CPC has done a fantastic job graphically depicting the impacts of La Nina on winter temperature and precipitation patterns for each event since 1950. The CPC ranked events from strongest to weakest. The resulting graphic representation of temperature and precipitation departures can be found at https://nsco.unl.edu/understanding-how-el-nino-la-nina-affected-midwest-climate-crops.
If you examine these CPC graphics, you will notice that there are years when La Nina conditions bring above-normal warmth to Nebraska, however, most years La Ninas bring below-normal winter temperatures. This reinforces the idea that La Nina conditions are not the sole dominant force responsible for our winter weather patterns.
During La Nina patterns, meteorologists will pay particular attention to the Arctic Oscillation. This index describes the relationship of pressure patterns in the Arctic Circle to jet stream winds near the 55 N latitude. Winds aloft in this region move from east to west. If winds are strong (like last winter), cold air has a difficult time moving from the Arctic region southward, resulting in mild conditions across the continental U.S. We call this the positive phase of the Arctic Oscillation.
Many of our bitterly cold La Nina winter patterns are tied directly to the negative phase of the Arctic Oscillation. Wind speeds aloft at 55 N relax and air is able to flow southward into the U.S., bringing outbreaks of bitter cold air. The average position of this cold air is directly influenced by the position of the Gulf of Alaska high pressure.
If the Gulf of Alaska high pressure is situated far enough eastward, the north to south flow on its eastern periphery would be directed toward areas east of the Mississippi River. If this high is in its normal position, the brunt of the cold air entering the U.S. will flow south into the northern and central Plains. If this high is situated west of its normal La Nina position, cold air outbreaks will be favored across the western third of the United States.
