A deepening upper air trough over the Great Lakes region brought an influx of cool Canadian air into the northwestern Corn Belt Sept. 5, resulting in isolated pockets of scattered frost from northwestern Minnesota southwest into the Nebraska Panhandle the morning of Sept. 6. Weather data from the Nebraska Mesonet indicates that the site five miles northeast of Whitman reached a low of 30.5°F, while the weather site 15 miles north of Angora reached 32°F. The Alliance airport Automated Surface Observation System recorded a low of 29°F.
Although frost damage assessment reports are not yet available, temperature data would suggest that crop damage will be minimal and isolated to areas favored by cold air drainage. These low-lying areas are often five degrees colder than nearby stations in areas not prone to cold-air pooling.
With this first taste of frost, it is time to look at where Growing Degree Day (GDD) accumulations sit as we enter the final growth stretch of the 2017 agricultural production season. Table 1 lists GDD accumulations from three emergence dates separated by two-week intervals. All stations in this table have accumulated at least 2000 GDDs since an April 30 emergence, 1900 GDDs since May 15 emergence, and 1800 GDDs since May 31 emergence.
| Location | GDD fROM April 30 Emergence* | GDD From May 15 Emergence* | GDD From May 31 Emergence* | Hybrid GDD/Days to Maturity | Hard Freeze Risk for April 30 Emergence** | Hard Freeze Risk for May 15 Emergence** |
Hard Freeze Risk for |
Replant | Hard Freeze Risk for May 15 Replant** | Hard Freeze Risk for May 31 Replant** |
|---|---|---|---|---|---|---|---|---|---|---|
| Alliance | 2019 | 1910 | 1806 | 2280/95 | 3% | 16% | 67% | 2159/90 | 7% | 16% |
| Scottsbluff | 2189 | 2068 | 1802 | 2280/95 | 3% | 16% | 56% | 2159/90 | 7% | 23% |
| Sidney | 2081 | 1970 | 1856 | 2352/98 | 3% | 13% | 79% | 2231/93 | 7% | 13% |
| Imperial | 2295 | 2167 | 2022 | 2594/108 | 3% | 40% | 89% | 2473/103 | 13% | 40% |
| McCook | 2498 | 2359 | 2208 | 2715/113 | 0 | 10% | 46% | 2594/108 | 3% | 26% |
| Alda | 2458 | 2315 | 2165 | 2715/113 | 3% | 26% | 86% | 2594/108 | 3% | 46% |
| Guide Rock | 2594 | 2442 | 2274 | 2715/113 | 0 | 13% | 33% | 2594/108 | 3% | 26% |
| York | 2581 | 2386 | 2214 | 2715/113 | 0 | 10% | 43% | 2594/108 | 3% | 23% |
| Dixon | 2326 | 2193 | 2056 | 2594/108 | 0 | 10% | 82% | 2473/103 | 3% | 33% |
| Mead | 2487 | 2338 | 2164 | 2715/113 | 0 | 7% | 33% | 2594/108 | 3% | 30% |
| Beatrice | 2601 | 2443 | 2262 | 2715/113 | 0 | 3% | 30% | 2594/108 | 0 | 16% |
| *Growing Degree Day accumulations since emergence date using upper limit of 86°F and lower limit of 50°F **Hard freeze risk is the first fall minimum temperature of 28°F or lower. Percent risk is determined using the 1987-2016 period and based on normal temperatures through corn black layer. |
||||||||||
The fifth column from the left reflects the typical GDD or total days to maturity for the corn hybrids grown at each listed location. Columns six through eight show the percent of time a hard freeze condition would occur, assuming normal temperatures through corn black layer. (The reference period for the hard freeze risk was 1987-2016.)
Table 1 indicates that the risk of a hard freeze, based on our most recent 30 years of climate data, is less that 5% at all sites with an April 30 emergence and less than 20% for a May 15 emergence. The risk increases dramatically, however, for a May 31 emergence date. Risk varies between 30% and 90%, with the highest risk assigned to the Panhandle and northern third of the state.
Because of the significant planting issues this spring during our unfavorable stretch of cool and wet weather, two additional columns of associated hard freeze risk have been included in Table 1. As is often the case, late planted or replanted corn varieties are typically shorter season varieties than those normally grown in the area to reduce the risk of late season hard freeze damage.
More
Also see Frost/Freeze Effects on Corn and Soybean, including tables of potential yield loss from damage at various growth stages. (Sept. 14, 2015 CW)
The replant data is based on planting hybrids that would mature five days earlier than hybrids listed for initial planting. This reduces the risk of a hard freeze to less than 15% for a May 15 emergence and less than 46% for a May 31 emergence date, with most locations below 30%.
Forecast for Precipitation and a Cool Down
Statistics are nice, but ultimately future weather patterns, not history, will determine our hard freeze risk. The good news is that this quick cool down has shifted east and will put the Great Lakes region at the greatest risk for scattered frost the mornings Sept. 8-9. A gradual warming trend will end all talk of frost conditions for another week as the Great Lakes upper air trough is replaced by high pressure aloft.
For the western Corn Belt, the ridging pattern responsible for exceptionally hot, dry weather across the western third of the U.S. for the last month is projected to break down next week. As the upper air ridge builds eastward, an upper air trough will build into the Pacific Northwest. Current weather model depictions of this trough evolution place it in the vicinity of the central Plains as early as Sept. 15. This system is currently projected to bring widespread moisture to Nebraska Sept. 16-18.
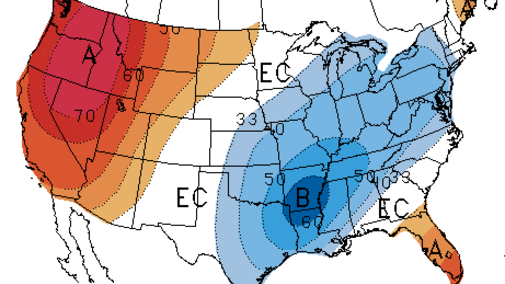
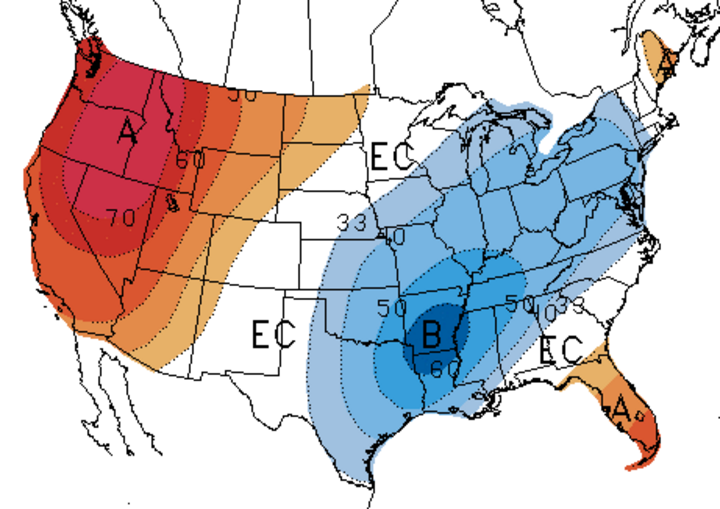
As the system moves northeast of the central Plains, cool Canadian air is pulled southward into the northern Plains. It doesn’t appear that enough cold air will be pulled southward to favor frost development, but the secondary push around Sept. 22 does bear watching for freezing temperatures across the northern Plains and Great Lakes region. Based on the National Weather Service 30-day forecast (Figure 1) and these current model forecasts, GDD accumulated totals for the next two weeks would add an additional 250-300 units to the totals in Table 1. By late September growers should expect just short of 400 accumulated GDD.
Hurricane Irma could significantly alter model performance of future events. There is considerable uncertainty in regards to the overall storm track as it approaches Florida Sunday morning. It is currently expected to turn due north once it reaches southern Florida, then race northward into the eastern coasts of Georgia and South Carolina. If it doesn’t make this turn, the eastern Gulf of Mexico region would be the most likely landfall area, with a few outlier models moving the system into Louisiana or northeastern Texas.
If Irma does continue northwestward into the western half of the Gulf of Mexico, it could link up with the western U.S. trough that will be developing next week. This could enhance precipitation in the western Corn Belt and lead to much colder air forecasted for the end of next week.
