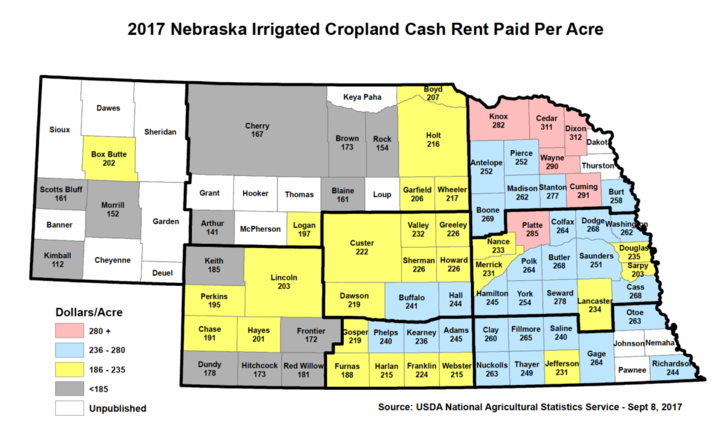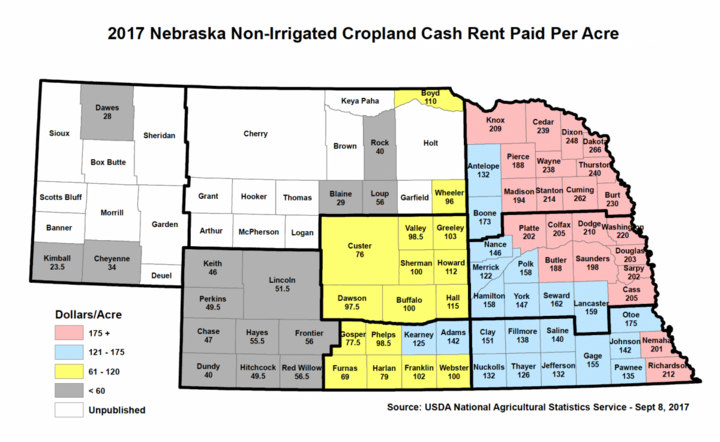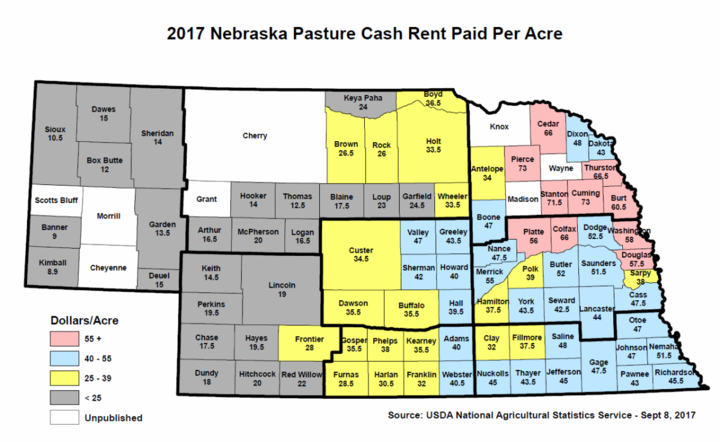

This week the USDA National Agricultural Statistics Service released its county level statistics on cash rental rates for irrigated and non-irrigated cropland and pastureland. Available in table and map form (Figures 1-3), the Nebraska rates are based on a random sample of nearly 16,000 producers who were surveyed from March through June.
In Nebraska the highest range of irrigated cash rental rates (shaded in pink) was from $282 in Knox County to $312 in Dixon County. The next highest range was from $236 in Kearney County to $278 in Seward County.
The highest level of non-irrigated cash rental rates—all in eastern Nebraska—ranged from $188 in Pierce and Butler counties to $266 in Dakota County.
The highest range of pasture cash rental rates was from $56 in Platte County to $73 in Pierce County.
The information is based on surveys conducted with Nebraska farmers and ranchers during the first half of 2017.
"These rents represent an average of all rates reported for a county, which means our data set included recently negotiated rents and those that may not have been updated for some time," notes Nick Streff, deputy regional director for the Northern Plains Regional Field Office in Lincoln. "These rental rates will not always represent the current market rate for a given county."

"These rents represent an average of all rates reported for a county, which means our data set included recently negotiated rents and those that may not have been updated for some time," notes Nick Streff, deputy regional director for the Northern Plains Regional Field Office in Lincoln. "These rental rates will not always represent the current market rate for a given county."
Jim Jansen, Nebraska Extension agricultural economist, noted that variability in crop and livestock prices appears to be influencing cash rental rates as well as ag land values. Counties where there are wide production swings from year to year are more apt to have lower cash rental rates due to inconsistent income potential.
The rate growers are willing to pay in rent appears to relate to the land's income-earning potential. If commodity or livestock prices drop, rental rates tend to follow suit, Jansen said.
The University of Nebraska-Lincoln Department of Agricultural Economics also tracks agland cash rental rates in Nebraska and released its most recent data earlier this year in the 2017 Nebraska Farm Real Estate Report. Its report is based on surveys made in early 2017. Rental rates published in 2017 declined an average of about 5% to 10% for the second consecutive year, with several rates dropping by more than 10%.
If you have questions about cash rental rates in Nebraska, contact Jansen at (402) 261-7572 or jjansen4@unl.edu.

