
Monitoring basis trends at area elevators can provide valuable information, which may help you garner a higher grain price.
Local cash grain prices can be broken down into two components, futures and basis. Expressed mathematically we have
1) Cash price = futures price + basis
Buyers and sellers of futures contracts determine the futures price for each commodity. Futures prices represent factors influencing global supply and demand for a commodity.
The basis represents factors influencing the local grain buyer. Individual grain buyers determine and adjust their own basis value depending on the local supply and demand, quality of grain, and the cost of doing business. For example, a local elevator might grade, store, and ultimately ship the grain to a processor. These costs are passed onto the farmer through basis. For any grain marketing decision there is a corresponding basis. Basis is the difference between the cash price and the futures price. By rearranging Equation 1 and moving futures price to the other side we have
2) Cash price – futures price = basis
Rearranging it again we have
3) Basis = cash price – futures price
Most of the time in Nebraska, basis values are negative. A negative basis can also be described as “under.” A positive basis, described as “over,” is also possible, indicating local demand is strong enough for the elevator to pay a premium over the futures price. It is incorrect to say that an "under" basis is weak while an "over" basis is strong. A weak or strong basis must be judged based on the average historical basis value.
Data
Tables and charts in the interactive visualization below were produced using price data for corn, soybean, and wheat reported by USDA’s Agricultural Marketing Service (USDA AMS) in the Cash Grain Bids sources for Nebraska (Omaha-Council Bluffs: WH_GR110, Nebraska Rural Elevators: WH_GR111, and Western Nebraska Elevators: TO_GR110). Prices are reported weekly using Thursday cash prices since 2009. (Not all locations are reported for all dates.) Locations listed have a population of 500 residents or more.
To find the location closest to you, select your city of residence. The visualization will identify the closest reported USDA AMS location. They include:
Corn: Beatrice, Bloomfield, Bridgeport, Chappell, Columbus, Dorchester, Elm Creek, Gering, Gordon, Grand Island, Greenwood, Hastings, Hay Springs, Hemingford, Holdrege, Imperial, Kimball, Lexington, McCook, Mitchell, Murdock, Ogallala, Omaha, Osceola, Oshkosh, Sidney, Superior, Wakefield
Soybeans: Beatrice, Columbus, Dorchester, Grand Island, Hastings, Holdrege, Imperial, Lexington, McCook, Merna, Omaha, Waverly
Winter Wheat: Beatrice, Bridgeport, Chappell, Dorchester, Gering, Gordon, Greenwood, Hastings, Hay Springs, Hemingford, Holdrege, Imperial, Kimball, Lexington, McCook, Ogallala, Oshkosh, Sidney, Superior
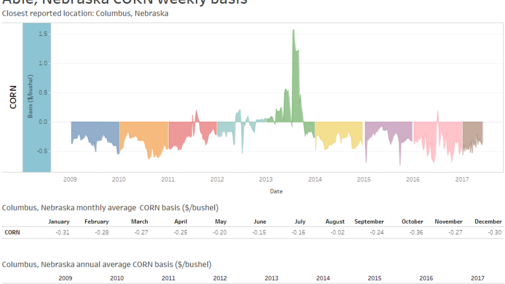
Basis is calculated by subtracting the closing price for the nearby futures contract from the reported USDA AMS cash price. Daily basis values are illustrated (above) using a graph. The horizontal axis of this graph displays time in days. The vertical axis represents dollars per bushel. The tables below the graph show the annual and monthly average basis, based on the filters on the right side of the visual.
It is recommended that producers maintain their own local historic basis data from area elevators to help understand and interpret current basis levels and trends. It likely will take some time to feel comfortable monitoring basis level and trends; however, your efforts will likely result in a stronger understanding of grain market fundamentals and higher cash price received.
