As you start making 2017 production plans, it is also time to start writing your pre-harvest marketing plan. Although we cannot predict 2017 prices, we can examine historical price patterns to help us determine a pre-harvest pricing strategy. These historical price patterns can be used to determine date goals and price expectations. Because of the record high ending stocks placing pressure on all three futures traded commodities, we will present both a 20-year average price pattern and a pattern for years with very high ending stocks for each.
Corn
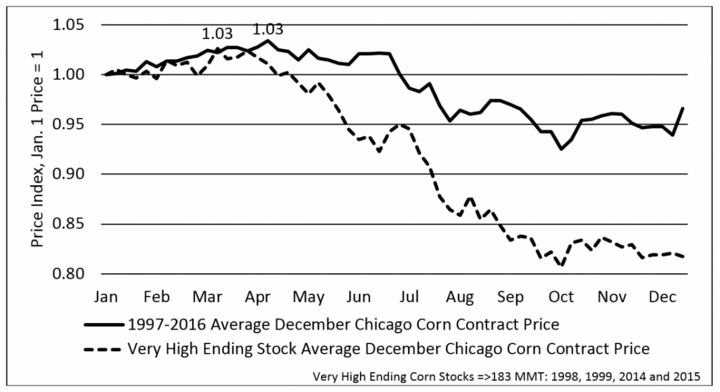
The 20-year and very high ending stock average price indices for new crop corn futures prices are illustrated in Figure 1. In this figure prices are normalized to 1.00 on January 1 to allow a comparison between historical price patterns. A 0.01 change in value indicates a 1% increase or decrease in price from the base of January 1. For example, an increase to 1.01 indicates a 1% increase in price from the base of January 1.
According to the 20-year average price index for new crop futures, corn prices are highest in April, rising 3% from the beginning of the year. The window for pricing corn above the January 1 price, according to the 20-year average price history, extends from January into July.
Considering very high ending stocks years―those years with global corn stocks greater than 183 MMT―the price peak over January 1 is at the same level, a 3% increase but the window of opportunity for grain above the January 1 price is much shorter ending in late April. Only four years are considered in the very high ending stocks average: 1998, 1999, 2014, and 2015.
The closing price for the December corn contract on January 3 was $3.84/bu. If 2017 follows either seasonal price pattern, we can expect the December Chicago corn price to peak at $3.96 per bushel. This pattern may not hold true during 2017 as factors other than the high global ending stock may influence prices. However, the USDA World Agricultural Supply and Demand Estimates Report (WASDE) does anticipate global corn ending stocks to be at a record high of 220 MMT at the end of the 2016/17 marketing year. Given this, pre-pricing corn early in 2017 may be advantageous for corn producers (Figure 1), especially since recent price rallies have already hit the anticipated price peak.
| Date | Closing Price | 2017 Price Index |
|---|---|---|
| 1/3/2017 | $3.84 | 1.000 |
| 1/4/2017 | $3.87 | 1.008 |
| 1/5/2017 | $3.89 | 1.013 |
| 1/6/2017 | $3.86 | 1.005 |
| 1/9/2017 | $3.88 | 1.010 |
| 1/10/2017 | $3.87 | 1.008 |
| 1/11/2017 | $3.86 | 1.006 |
| 1/12/2017 | $3.86 | 1.007 |
| 1/13/2017 | $3.86 | 1.007 |
| 1/17/2017 | $3.93 | 1.023 |
| 1/18/2017 | $3.92 | 1.022 |
| 1/19/2017 | $3.94 | 1.026 |
| 1/20/2017 | $3.96 | 1.032 |
Soybeans
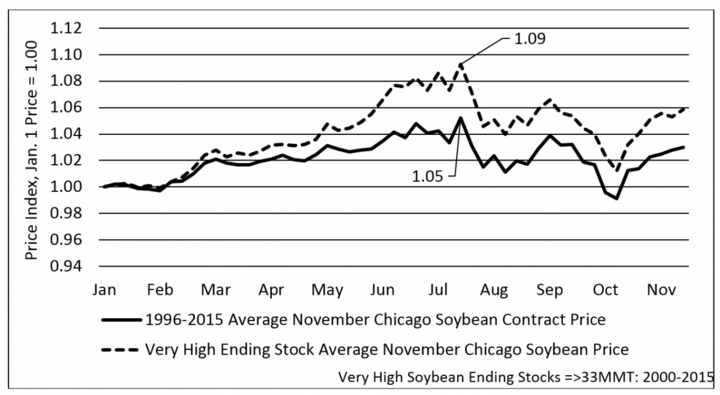
The 20-year and very high ending stock average price indices for new crop soybeans are illustrated in Figure 2. Just as with corn (Figure 1), prices are normalized to 1.00 on January 1 to allow a comparison between historical price patterns.
Figure 2, Average and very high average ending stock price indices for the November Chicago soybean contract, 1997-2016.
According to the 20-year average price index for new crop soybeans, prices are highest in July, rising 5% during this time period. The window for pricing new crop soybeans above the January 1 price extends into harvest in October.
Considering the very high ending stocks index, those with global soybean stocks greater than 33 MMT, the price increase over January 1 is higher at 9% but the window of opportunity for grain above the January 1 price is extended through the end of the marketing year. Seventeen of the last twenty years fall into the very high global ending stocks category. This is a factor in the similarity in the indices.
The closing price for the November soybean contract on January 3 was $9.83/bu. If 2017 follows the seasonal price pattern, we can expect the November Chicago soybean price to peak around $10.32 - $10.71 per bushel. Unlike corn producers, soybean producers have more time to consider their pre-harvest pricing options.
| Date | Closing Price | 2017 Price Index |
|---|---|---|
| 1/3/2017 | $9.83 | 1.000 |
| 1/4/2017 | $9.99 | 1.016 |
| 1/5/2017 | $9.96 | 1.013 |
| 1/6/2017 | $9.83 | 0.999 |
| 1/9/2017 | $9.94 | 1.011 |
| 1/10/2017 | $10.00 | 1.017 |
| 1/11/2017 | $9.98 | 1.015 |
| 1/12/2017 | $10.17 | 1.034 |
| 1/13/2017 | $10.19 | 1.036 |
| 1/17/2017 | $10.20 | 1.037 |
| 1/18/2017 | $10.28 | 1.046 |
| 1/19/2017 | $10.30 | 1.047 |
| 1/20/2017 | $10.29 | 1.046 |
Winter Wheat
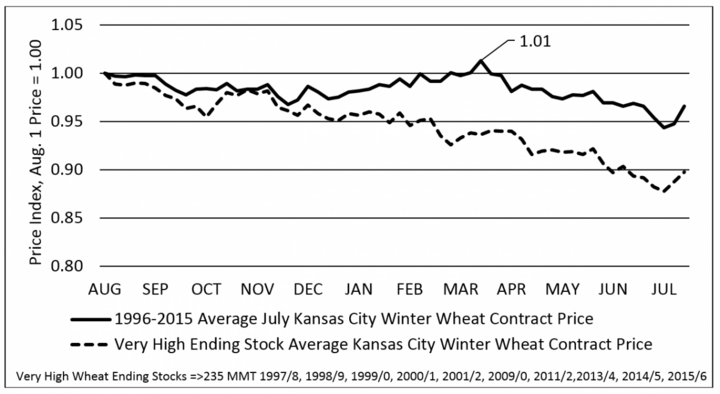
The 20-year and very high ending stock average price indices for the July Kansas City winter wheat contract are illustrated in Figure 3. In this chart, prices are normalized to 1.00 on August 1 to allow a comparison between historical price patterns.
According to the 20-year average price index for new crop winter wheat, prices are highest in March, rising 1% above August 1. The opportunity to pre-price new crop winter wheat does not improve when viewing the very high ending stocks index. New crop prices in years with global ending stocks greater than 236 MMT on average never exceed the August 1 price, and gradually decline throughout the marketing year.
USDA WASDE predicts record high global ending wheat stocks at 253 MMT for 2016/2017. Winter wheat producers have had a few opportunities to price new crop wheat at or above the August 1 price. Winter wheat producers looking to pre-price for delivery at harvest should consider contracting sooner, rather than waiting later into the season.
| Date | Closing Price | 20161/7 Price Index | Date | Closing Price | 2016/17 Price Index | Date | Closing Price | 2016/17 Price Index |
|---|---|---|---|---|---|---|---|---|
| 8/1/16 | $4.72 | 1.00 | 9/27/16 | $4.56 | 0.97 | 11/22/16 | $4.57 | 0.97 |
| 8/2/16 | $4.70 | 0.99 | 9/28/16 | $4.58 | 0.97 | 11/23/16 | $4.57 | 0.97 |
| 8/3/16 | $4.76 | 1.01 | 9/29/16 | $4.54 | 0.96 | 11/25/16 | $4.53 | 0.96 |
| 8/4/16 | $4.69 | 0.99 | 9/30/16 | $4.53 | 0.96 | 11/28/16 | $4.53 | 0.96 |
| 8/5/16 | $4.74 | 1.00 | 10/3/16 | $4.45 | 0.94 | 11/29/16 | $4.41 | 0.93 |
| 8/8/16 | $4.72 | 1.00 | 10/4/16 | $4.41 | 0.93 | 11/30/16 | $4.33 | 0.92 |
| 8/9/16 | $4.72 | 1.00 | 10/5/16 | $4.53 | 0.96 | 12/1/16 | $4.27 | 0.90 |
| 8/10/16 | $4.74 | 1.00 | 10/6/16 | $4.43 | 0.94 | 12/2/16 | $4.33 | 0.92 |
| 8/11/16 | $4.74 | 1.00 | 10/7/16 | $4.41 | 0.93 | 12/5/16 | $4.33 | 0.92 |
| 8/12/16 | $4.78 | 1.01 | 10/10/16 | $4.45 | 0.94 | 12/6/16 | $4.29 | 0.91 |
| 8/15/16 | $4.73 | 1.00 | 10/11/16 | $4.44 | 0.94 | 12/7/16 | $4.24 | 0.90 |
| 8/16/16 | $4.73 | 1.00 | 10/12/16 | $4.36 | 0.92 | 12/8/16 | $4.29 | 0.91 |
| 8/17/16 | $4.79 | 1.01 | 10/13/16 | $4.53 | 0.96 | 12/9/16 | $4.38 | 0.93 |
| 8/18/16 | $4.82 | 1.02 | 10/14/16 | $4.56 | 0.97 | 12/12/16 | $4.39 | 0.93 |
| 8/19/16 | $4.80 | 1.02 | 10/17/16 | $4.61 | 0.98 | 12/13/16 | $4.39 | 0.93 |
| 8/22/16 | $4.76 | 1.01 | 10/18/16 | $4.61 | 0.98 | 12/14/16 | $4.43 | 0.94 |
| 8/23/16 | $4.70 | 0.99 | 10/19/16 | $4.65 | 0.98 | 12/15/16 | $4.36 | 0.92 |
| 8/24/16 | $4.70 | 1.00 | 10/20/16 | $4.63 | 0.98 | 12/16/16 | $4.39 | 0.93 |
| 8/25/16 | $4.68 | 0.99 | 10/21/16 | $4.62 | 0.98 | 12/19/16 | $4.38 | 0.93 |
| 8/26/16 | $4.54 | 0.96 | 10/24/16 | $4.54 | 0.96 | 12/20/16 | $4.37 | 0.92 |
| 8/29/16 | $4.40 | 0.93 | 10/25/16 | $4.54 | 0.96 | 12/21/16 | $4.33 | 0.92 |
| 8/30/16 | $4.35 | 0.92 | 10/26/16 | $4.58 | 0.97 | 12/22/16 | $4.31 | 0.91 |
| 8/31/16 | $4.35 | 0.92 | 10/27/16 | $4.58 | 0.97 | 12/23/16 | $4.29 | 0.91 |
| 9/1/16 | $4.43 | 0.94 | 10/28/16 | $4.53 | 0.96 | 12/27/16 | $4.41 | 0.93 |
| 9/2/16 | $4.49 | 0.95 | 10/31/16 | $4.56 | 0.97 | 12/28/16 | $4.32 | 0.91 |
| 9/6/16 | $4.47 | 0.95 | 11/1/16 | $4.55 | 0.96 | 12/29/16 | $4.38 | 0.93 |
| 9/7/16 | $4.49 | 0.95 | 11/2/16 | $4.57 | 0.97 | 12/30/16 | $4.41 | 0.93 |
| 9/8/16 | $4.55 | 0.96 | 11/3/16 | $4.52 | 0.96 | 1/3/17 | $4.37 | 0.92 |
| 9/9/16 | $4.55 | 0.96 | 11/4/16 | $4.54 | 0.96 | 1/4/17 | $4.49 | 0.95 |
| 9/12/16 | $4.60 | 0.97 | 11/7/16 | $4.52 | 0.96 | 1/5/17 | $4.57 | 0.97 |
| 9/13/16 | $4.52 | 0.96 | 11/8/16 | $4.59 | 0.97 | 1/6/17 | $4.57 | 0.97 |
| 9/14/16 | $4.55 | 0.96 | 11/9/16 | $4.51 | 0.95 | 1/9/17 | $4.62 | 0.98 |
| 9/15/16 | $4.53 | 0.96 | 11/10/16 | $4.50 | 0.95 | 1/10/17 | $4.61 | 0.98 |
| 9/16/16 | $4.54 | 0.96 | 11/11/16 | $4.51 | 0.95 | 1/11/17 | $4.55 | 0.96 |
| 9/19/16 | $4.54 | 0.96 | 11/14/16 | $4.44 | 0.94 | 1/12/17 | $4.69 | 0.99 |
| 9/20/16 | $4.55 | 0.96 | 11/15/16 | $4.49 | 0.95 | 1/13/17 | $4.73 | 1.00 |
| 9/21/16 | $4.59 | 0.97 | 11/16/16 | $4.44 | 0.94 | 1/17/17 | $4.75 | 1.01 |
| 9/22/16 | $4.57 | 0.97 | 11/17/16 | $4.49 | 0.95 | 1/18/17 | $4.76 | 1.01 |
| 9/23/16 | $4.58 | 0.97 | 11/18/16 | $4.54 | 0.96 | 1/19/17 | $4.66 | 0.99 |
| 9/26/16 | $4.51 | 0.95 | 11/21/16 | $4.55 | 0.96 | 1/20/17 | $4.67 | 0.99 |
Conclusion
Very high ending stocks appear to incentivize more forward contracting than average ending stock years. Between crops, we find pre-harvest marketing corn and winter wheat should be done earlier in the crop year than soybeans. This is not to say that when a favorable soybean price is given early in the year that you shouldn’t consider forward contracting.
Caution must be given to not over selling pre-harvest bushels. Although price risk is reduced by pre-pricing, farmers are still exposed to yield risk. Yield risk is partially mitigated by crop insurance. A widely accepted rule of thumb is not to pre-harvest market more production than you have insured. In the end, you must determine the amount of your expected production you are comfortable pre-harvest pricing. Not pre-harvest pricing any grain is an option. However, market fundamentals suggest producers should engage in some forward contracting to capture high futures prices during the growing season.
These data and comments are provided for information purposes only and are not intended to be used for specific grain marketing strategies. Past performance is not necessarily indicative of future results. Grain marketing involves risk, and you should fully understand those risks before pricing grain.
For more information on grain marketing, consider attending one of the Nebraska Extension Grain Marketing Workshops being held across the state through March or see related grain marketing articles in CropWatch.
