Most of our readers are familiar with the NOAA Climate Prediction Center's (CPC) 6-10 day, 8-14 day, 30 day, and 90 day outlooks (Figures 1 and 2). One of the most common complaints I have heard from the public is that these maps are difficult to interpret due to the lack of physical values that can be assigned to outlook maps.
It is not very often that a suite of products comes along that not only provides an estimate of future conditions, but assigns a physical value to those estimates. The latest addition to the CPC maps – the interactive editions – I believe are the single greatest leap in product development since the 1990s when they introduced their seasonal outlooks looking 18 months into the future. Now you can get the physical normal data for your location for one of the four periods you choose, along with the percentage estimate that a given area will be above normal, normal, or below normal.
Here's how to access and customize these maps for your location.
If you visit the CPC website you will notice in the map area on the main page that there is an interactive link in parenthesis for the 6-10, 8-14, 30, and 90 day outlooks (Figure 3).
Each of these interactive links are created in a similar fashion, so the 6-10 day interactive forecast for May 4, 2017 will be used in this example. Each of the remaining three interactive links and their associated climate outlook statistics can be accessed using the same method in this example. Click on the 6-10 day interactive link (the first red circle "Interactive" in Figure 1).
A default map will appear, with College Park, Maryland data on the left side of the screen (Figure 3). On the map, you will see a green teardrop signifying the location of this data and climatological outlook data for this location.


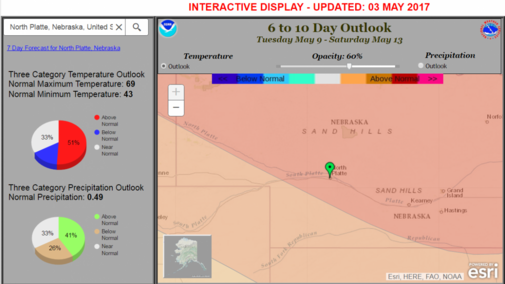
To change the location, enter the physical location or zip code in the “Find Address or Place” box in the upper left corner of the page. For our example, we will enter North Platte, Nebraska (Figure 4) in the location finder on the left. The map will automatically zoom in to the North Platte area, with the green teardrop over North Platte. The outlook period (May 9 - 13) for this example appears above the map. The left side of the screen shows:
- average high (normal maximum temperature): 75°F,
- average low (normal minimum temperature): 52°F, and
- normal precipitation: 0.49.
Pie charts indicate the probabilities that the listed values (temperature and precipitation) will be above normal, below normal, or normal.
If you click on the “Outlook” button under “Precipitation” above the map, the map will change to a 6-10 day precipitation outlook map (Figure 5).
Now, to review the information for your location, click your location on the map and the green teardrop will move there. (Or, use the location box in the upper left corner, as we did in the screen capture, to input the name of the closest town or zip code.) The numbers and pie charts on the left side will adjust accordingly to your probabilities in relation to the underlying forecast map and the associated precipitation and temperature climatological values for this outlook period.
On the left side, just above the temperature data is a link to the latest NWS seven-day forecast for that area. The 6-10 and 8-14 day graphics are updated daily, while the 30- and 90-day maps are updated the third Thursday of the month (generally between the 15th and 22nd). The CPC will update the 30-day forecast around 3 p.m. CST on the last day of each month.
